Global Topology
Last Updated:2025-11-14
Function overview
The global topology provides a clear visualization of dependencies and call relationships among complex applications. Real-time data access, application status identification, and performance insights help pinpoint critical nodes affecting application functionality. By analyzing upstream/downstream dependencies, it delivers a comprehensive evaluation of application performance and health. Key metrics supported include total requests, average error rate, and average latency.
Usage steps
- Log in to the Baidu AI Cloud console.
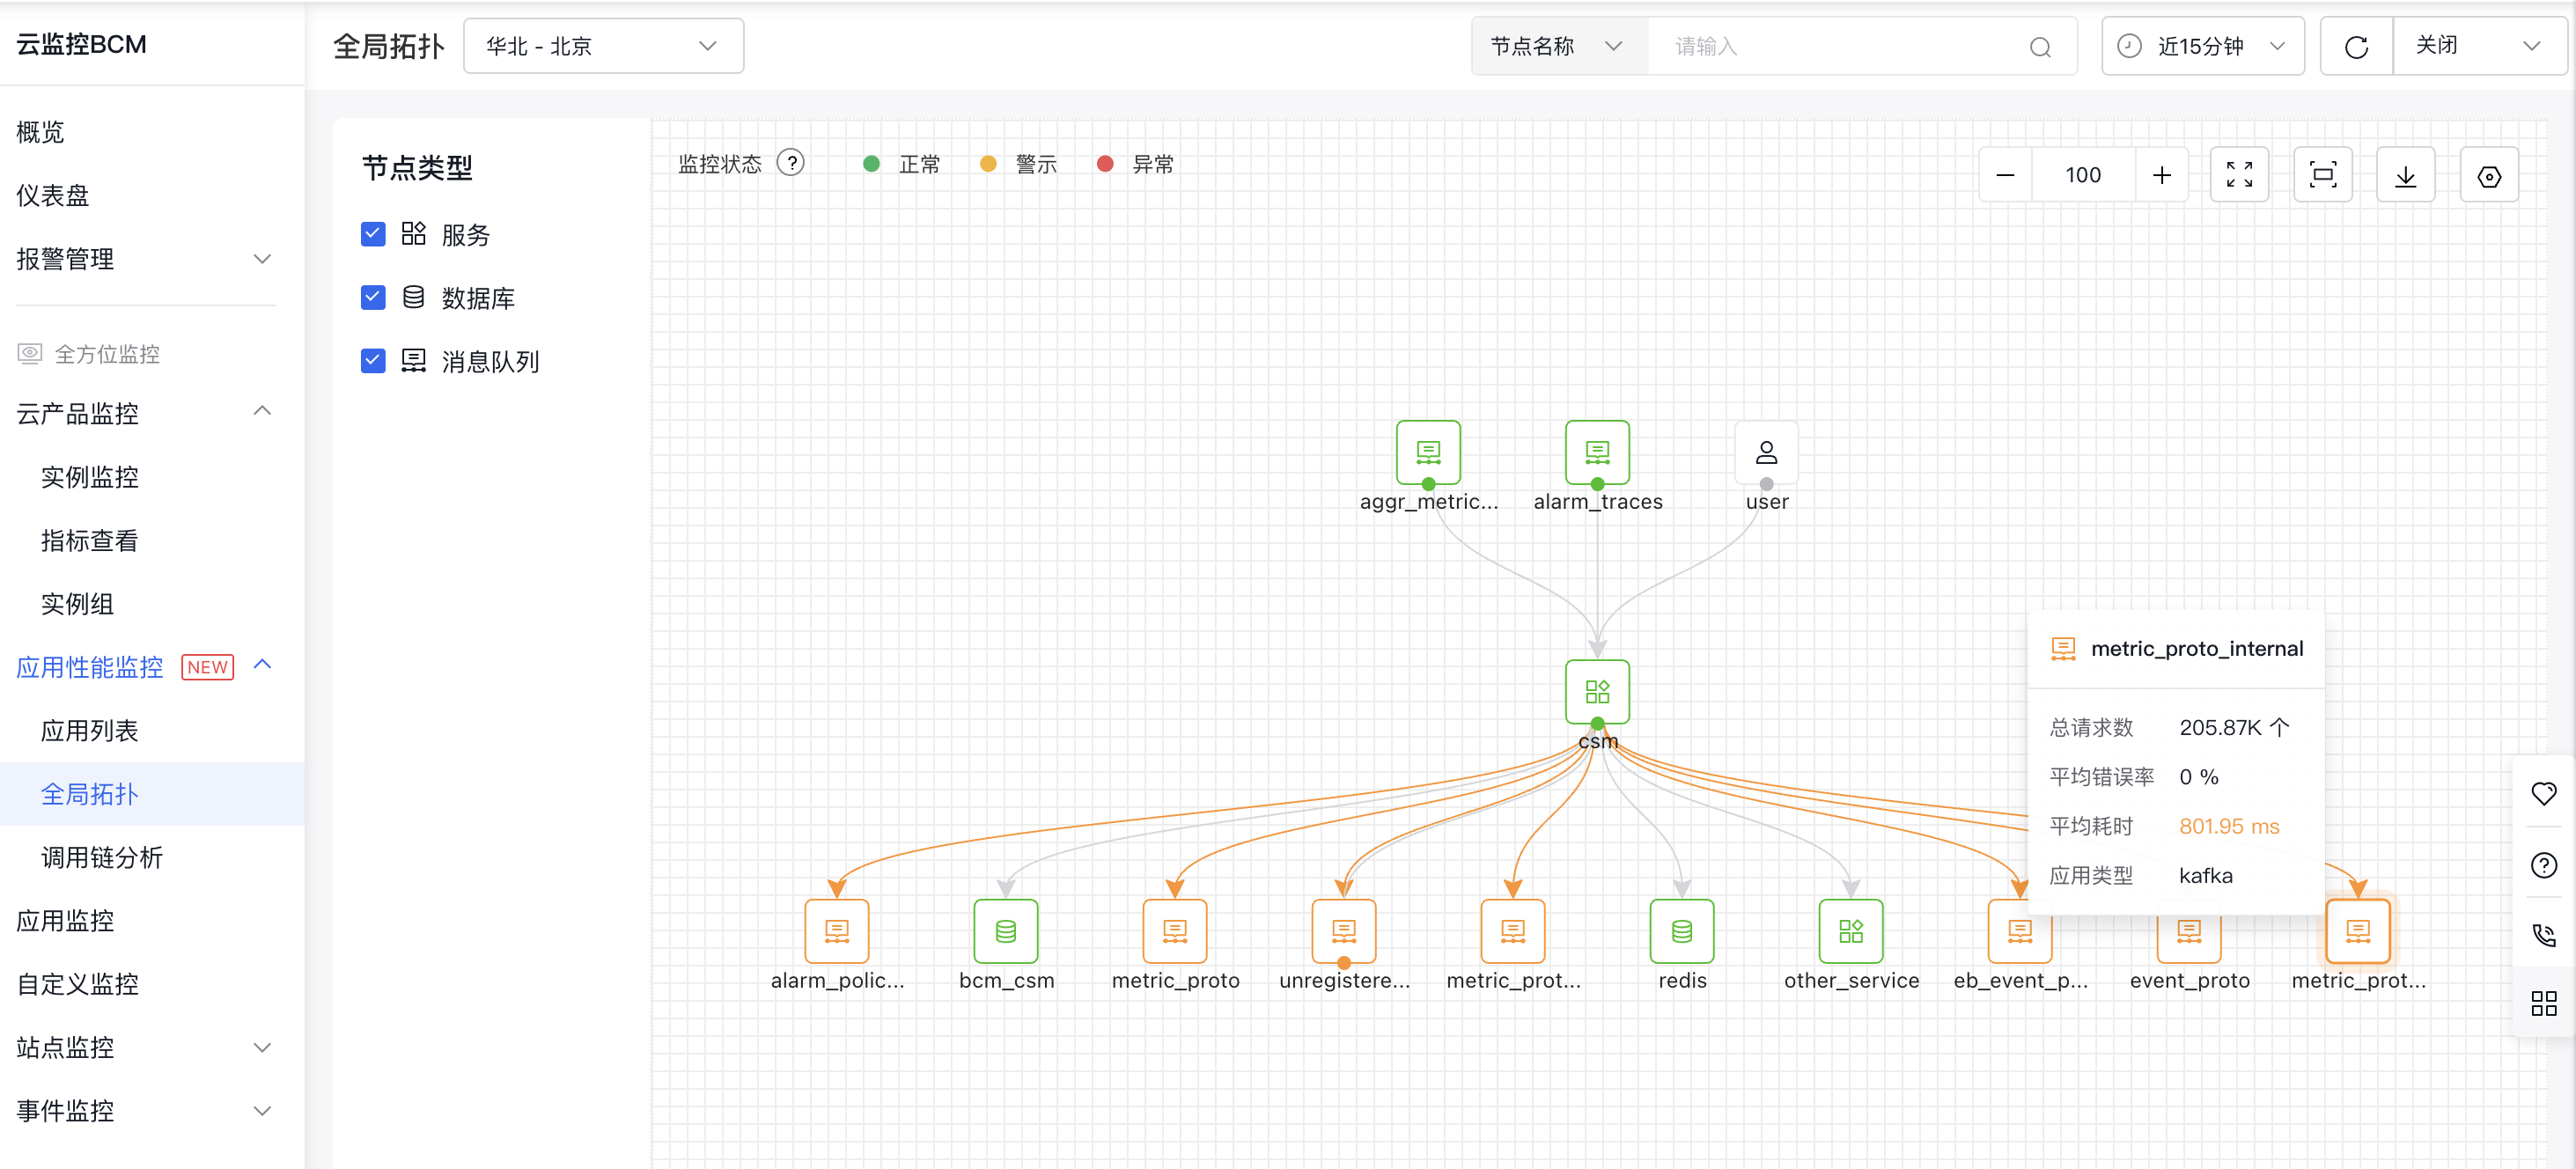
- In the left navigation panel, click "Application Performance Monitor," then navigate to "Global Topology." Select the desired region at the top and specify the time period on the right.
| Field | Description |
|---|---|
| Monitor status | Assess the application's health status by evaluating key metrics such as average error rate and average latency. |
-
The global topology page illustrates the call relationships between applications during the selected timeframe.
- Hover over a node to view the corresponding request count, error rate, and latency of the node;
- Hover over the line between nodes to view request count, error rate, and latency information between the two nodes.
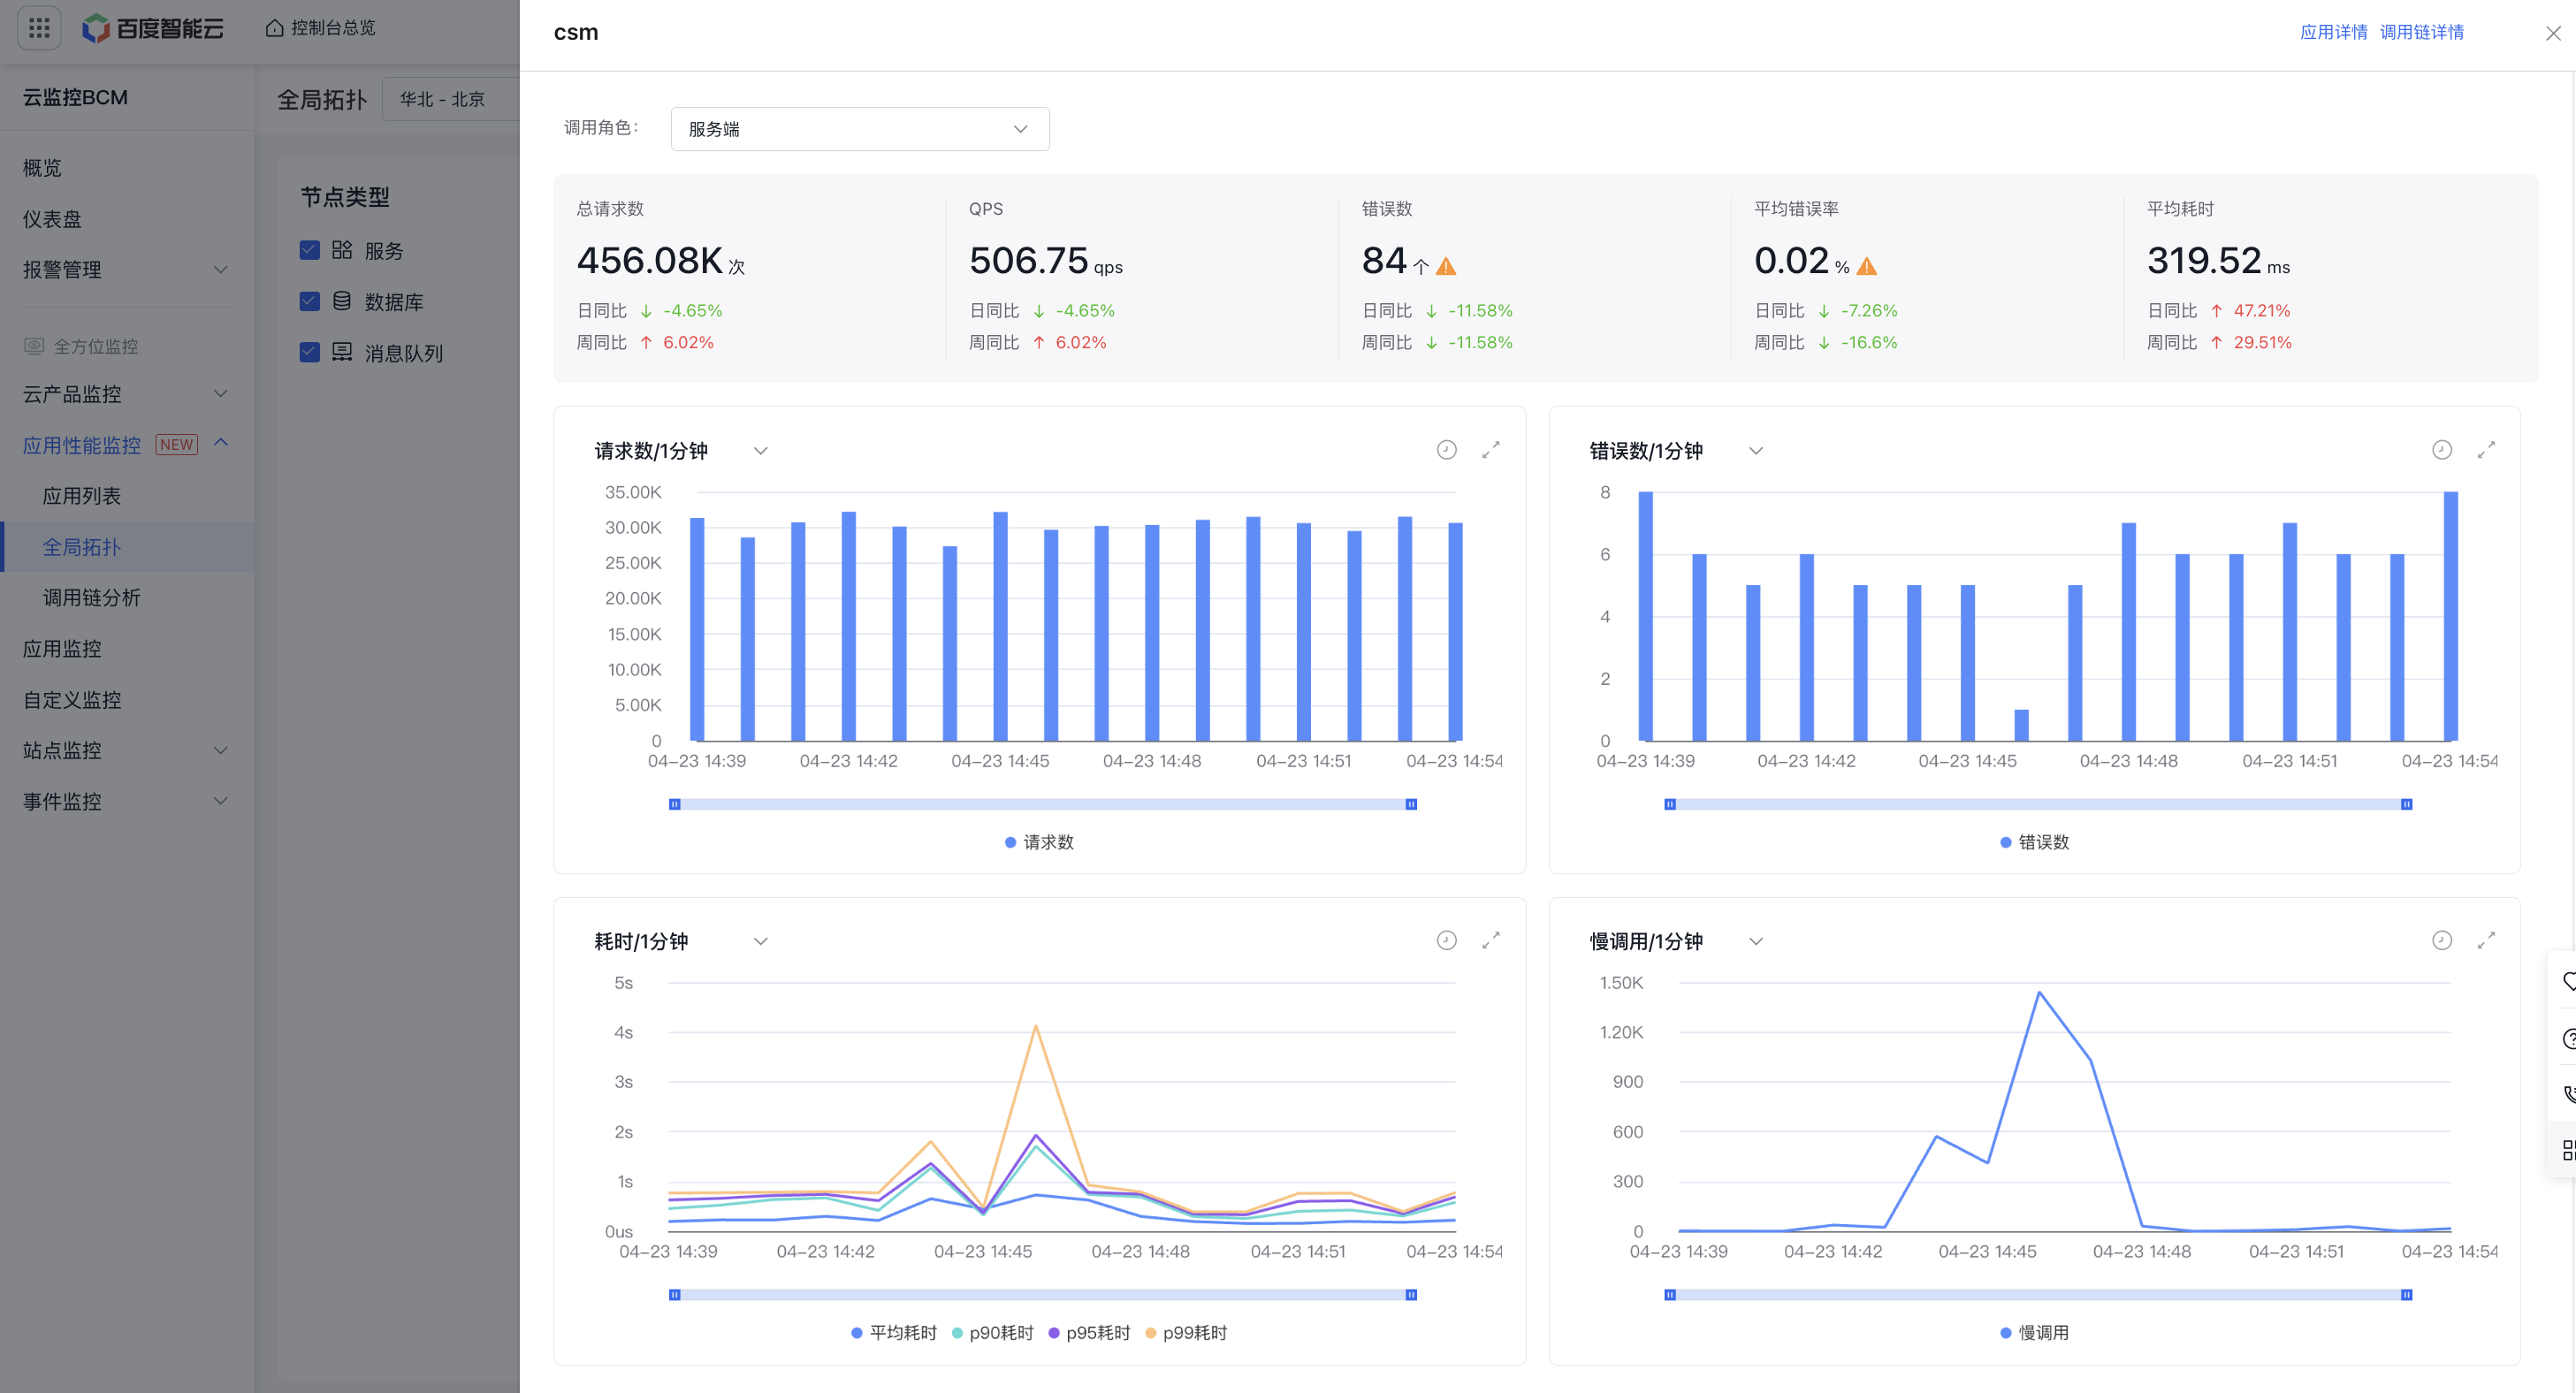
- Click on a node to view metrics like request count, error rate, latency, and slow calls for specific roles in the right panel. Use the entry point in the top-right corner for quick access to either the Application Details or Call Chain Analysis pages.