Alarm history
Last Updated:2025-11-14
Function overview
When an alarm is triggered, you can filter alarm details on the Alarm History page using criteria like product type, alarm level, and current status.
View alarm history
- Log in to Baidu AI Cloud, select Baidu Cloud Monitor (BCM), and navigate to Alarm Management -> Alarm History in the left navigation bar to open the Alarm History List page.
- Switch between tabs to view alarm history for cloud product monitors, site monitors, custom monitors, and application monitors.

Description:
Currently, cloud product monitor distinguishes between metric alarm history and event alarm history, as described below:
- Metric alarm history: Displays alarms with a "lifecycle," covering the complete process from triggering to closure. When an event is closed and subsequently triggered again, a new alarm record will be created. You can check the current alarm status under Current Status and click on Strategy Name to view the strategy's details.
- Event alarm history: Display alarm details including occurrence time, cloud product name, region, alarm content, strategy name, and other event information
View alarm details
- Log in to Baidu AI Cloud, select Baidu Cloud Monitor (BCM), and navigate to Alarm Management -> Alarm History in the left navigation bar to open the Alarm History List page.
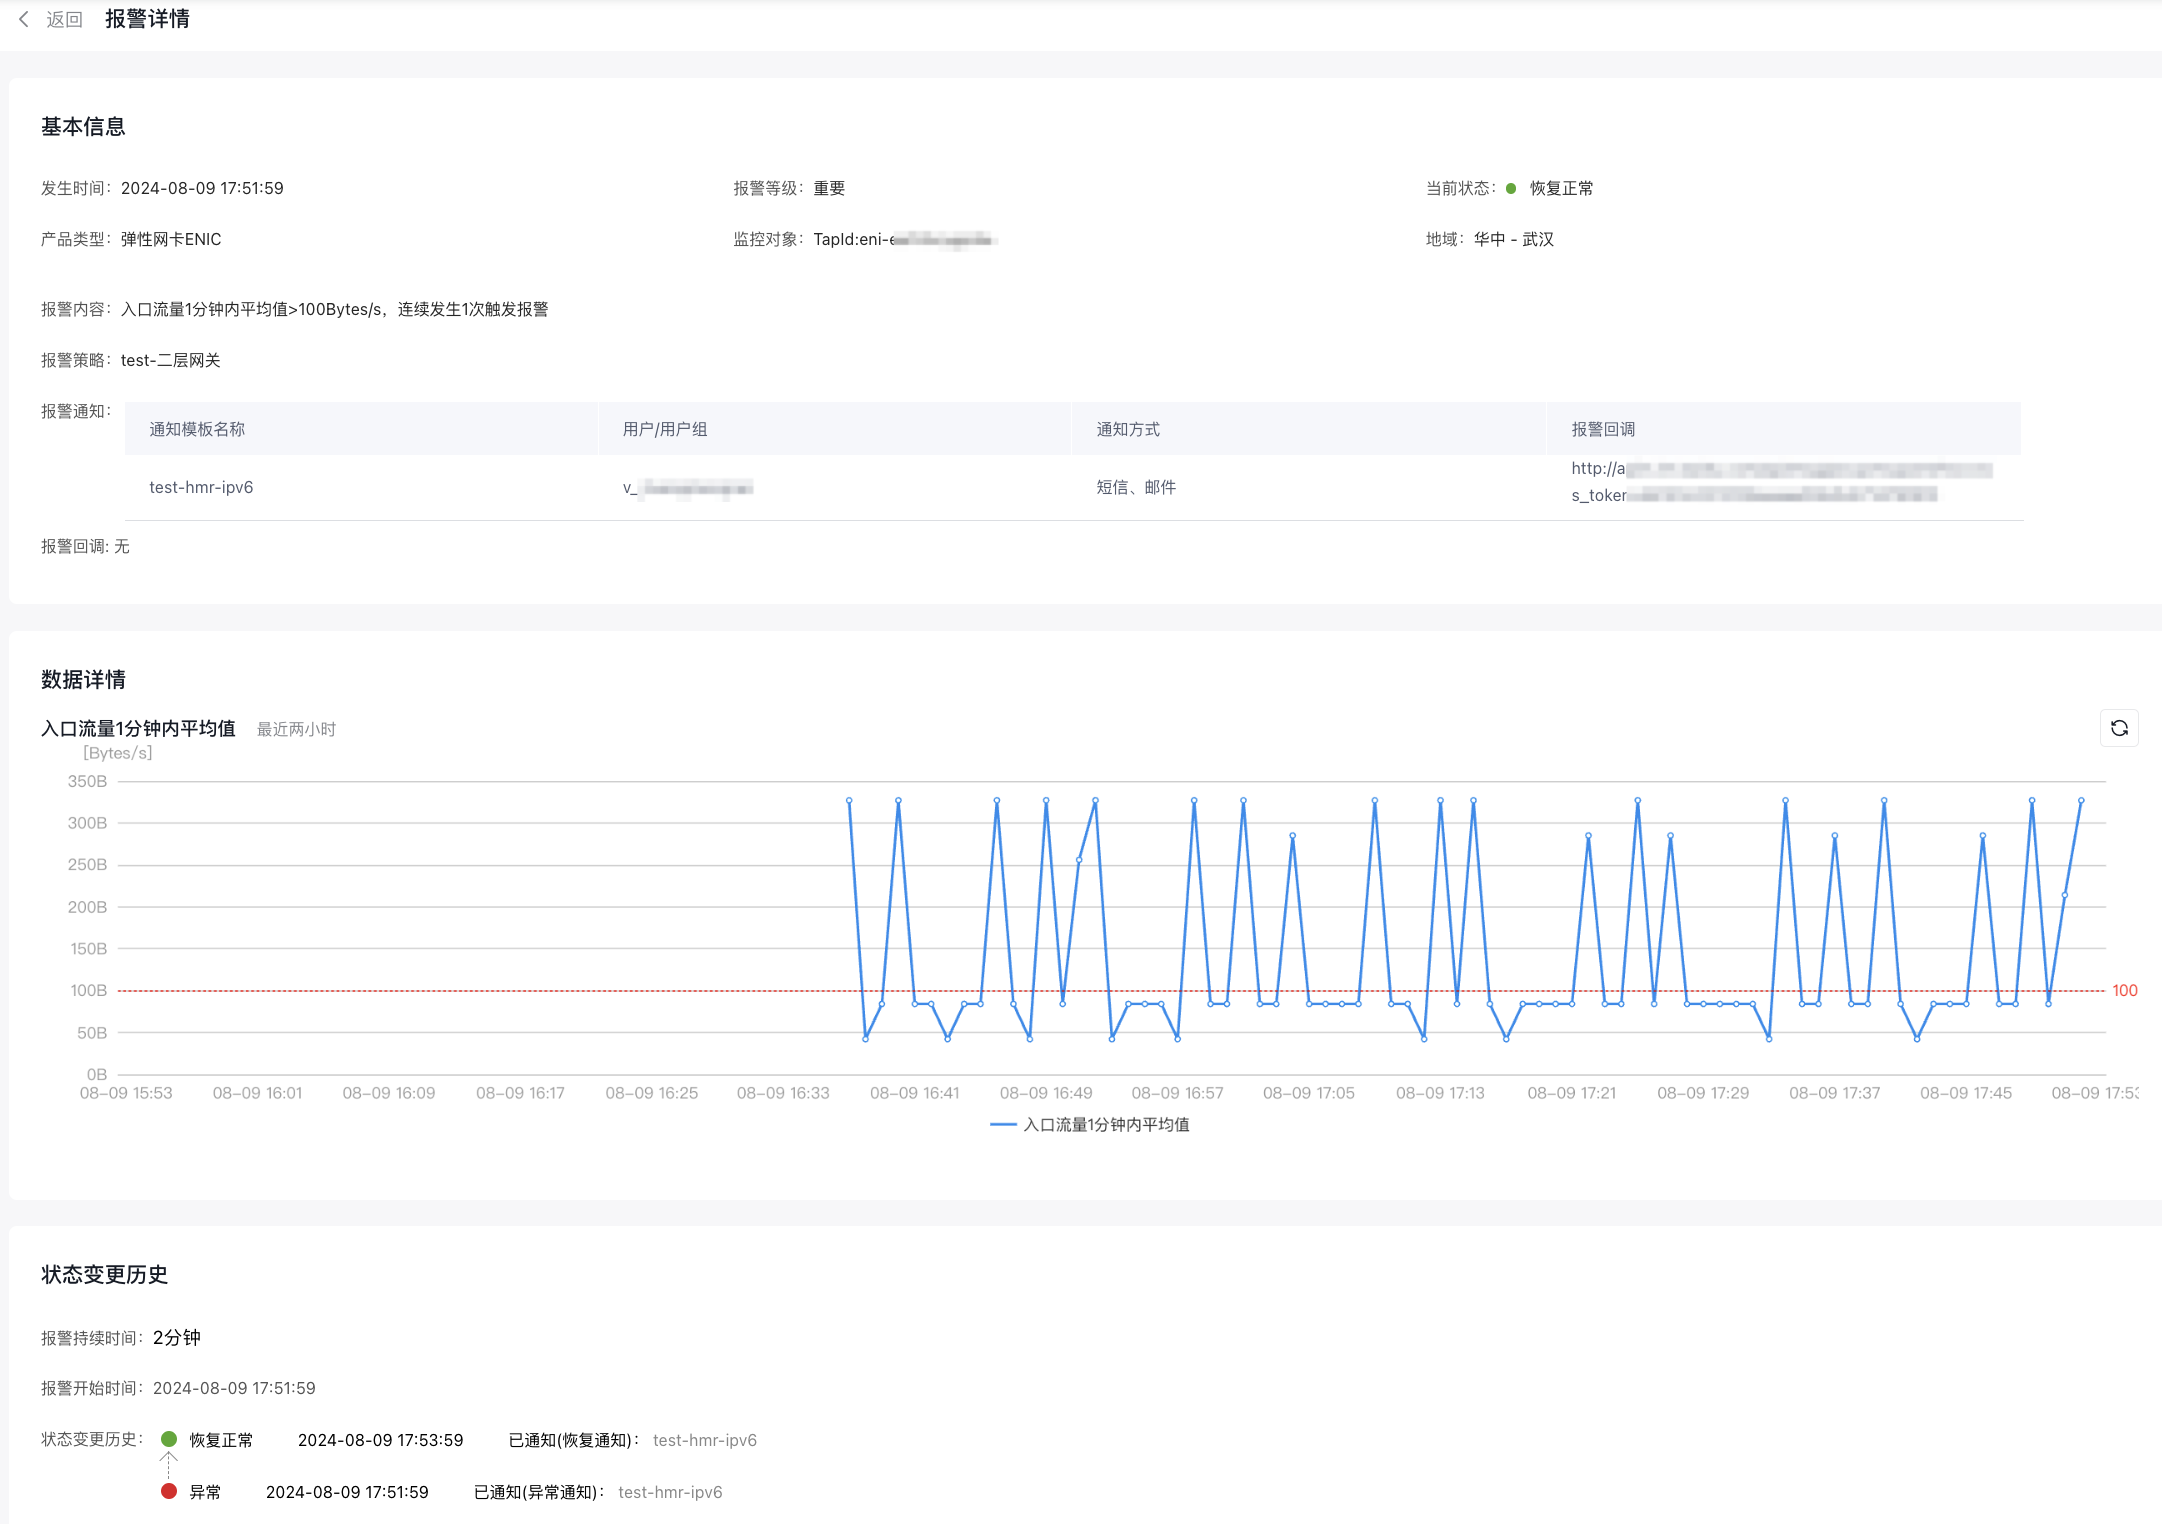
- On the Alarm History page, click Alarm Content to open the details page of the specific alarm event you wish to review.

- On the Alarm Event Details page, view the alarm event's basic information, monitoring data, and history of status changes.

