Log monitor
Last Updated:2025-11-14
Log monitor
Log Monitoring: Provide multi-dimensional metric monitoring for instances and application types through local log collection, parsing, and the setup of monitoring and alarm items. This forms a comprehensive log monitoring loop when integrated with other Baidu Cloud Monitor features.
Create a log monitor task
- On the Application Monitor page, click the application's name to open the corresponding Details page.
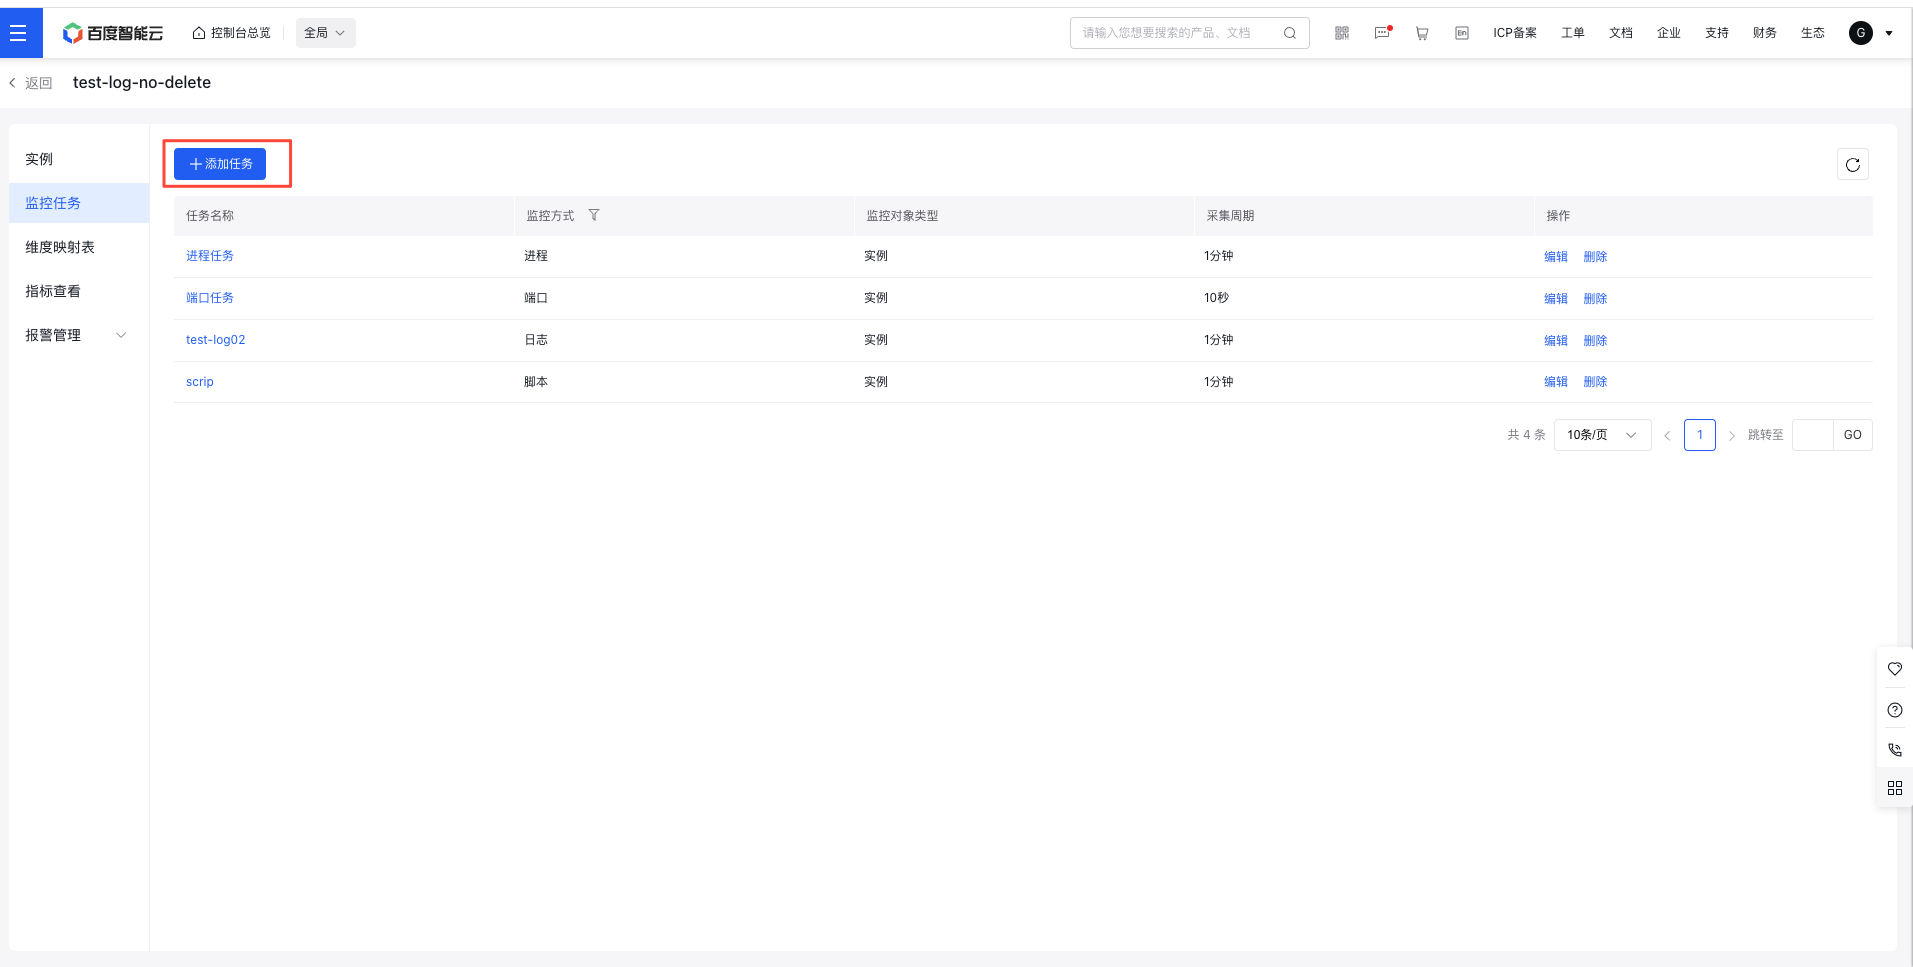
- In the left navigation panel, click on the Monitor Task tab to navigate to the Monitor Task page.
- On the Monitor Task page, click the Create Task button to access the Create Monitor Task page.
- On the "Create Monitor Task" page, select "Log" as the monitoring method, fill in the form, and complete the task creation process.
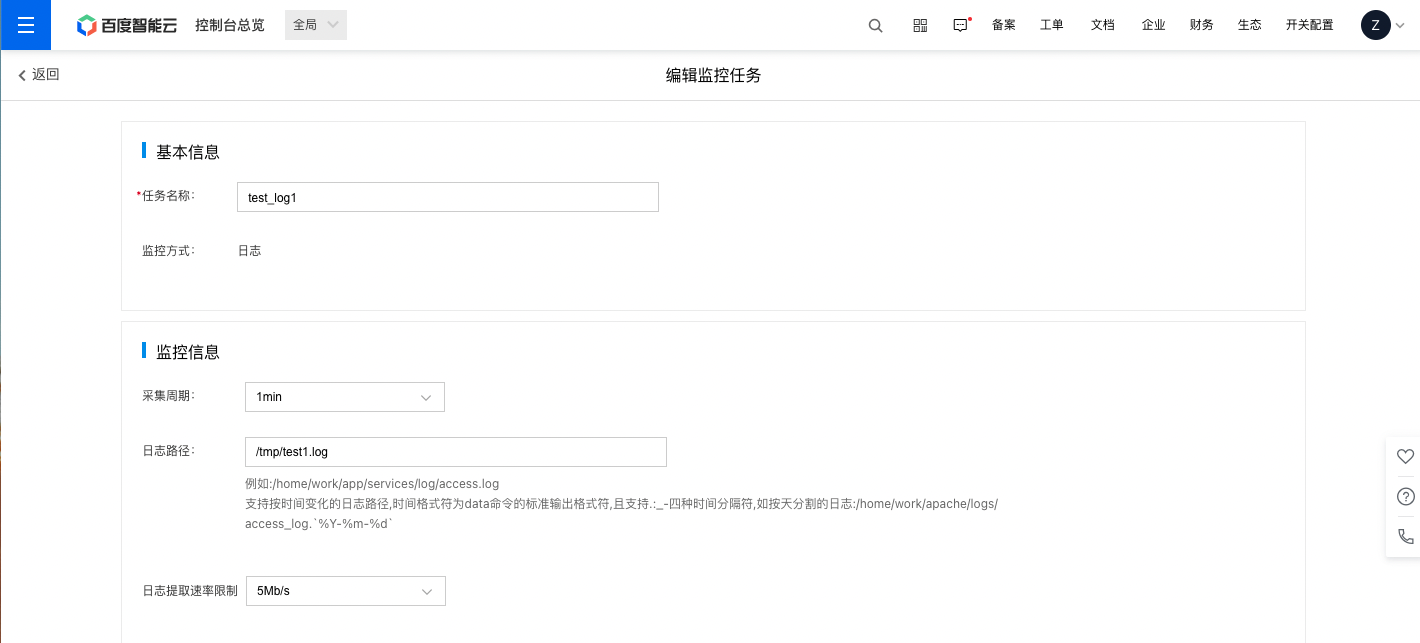
Step 1: Input the basic details and monitoring information for the task.
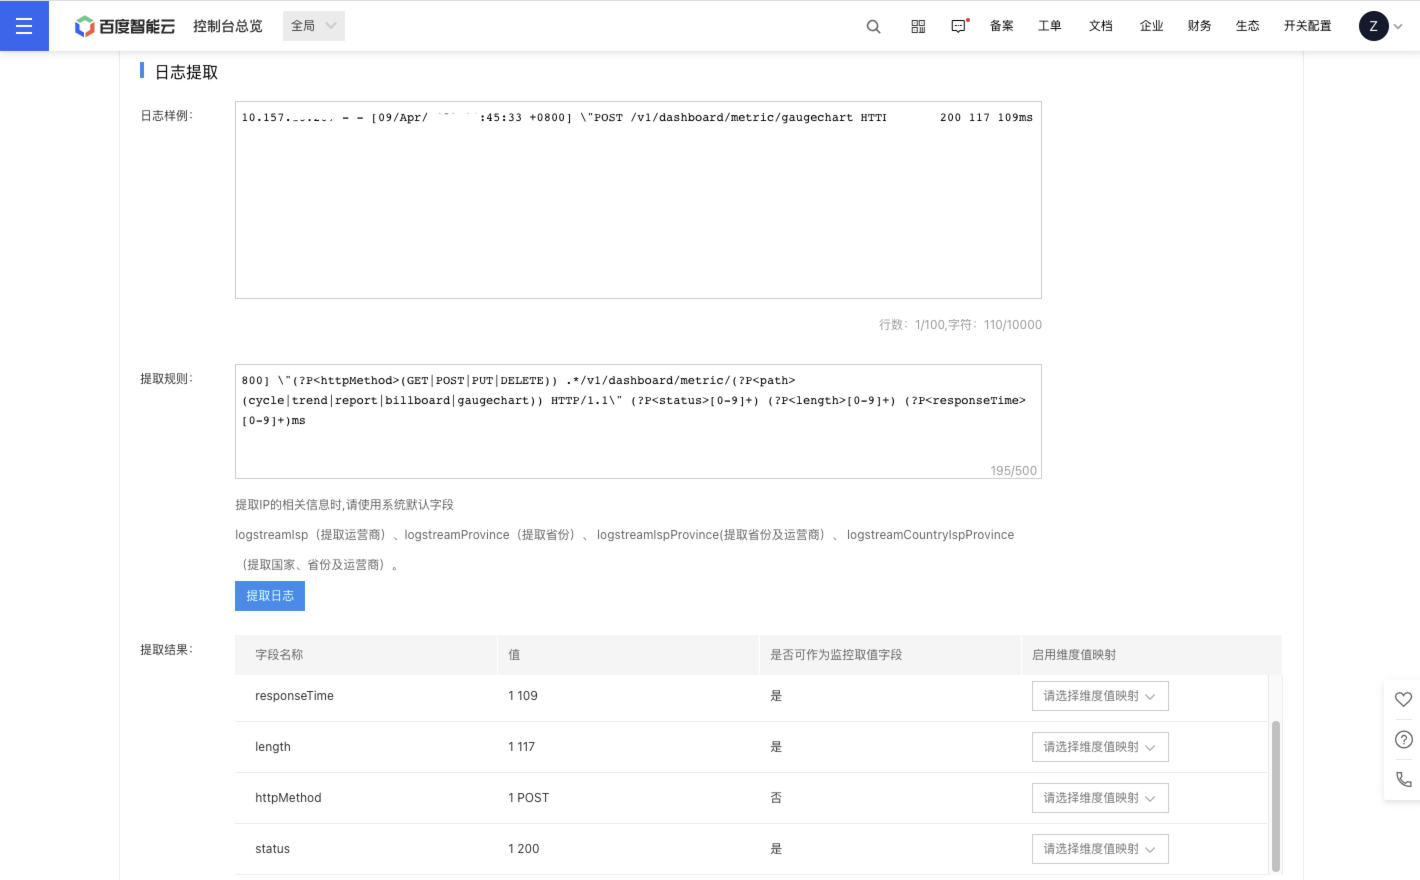
Step 2: Once you finish extracting log information, click the "Extract Logs" button to view the corresponding details of the results.
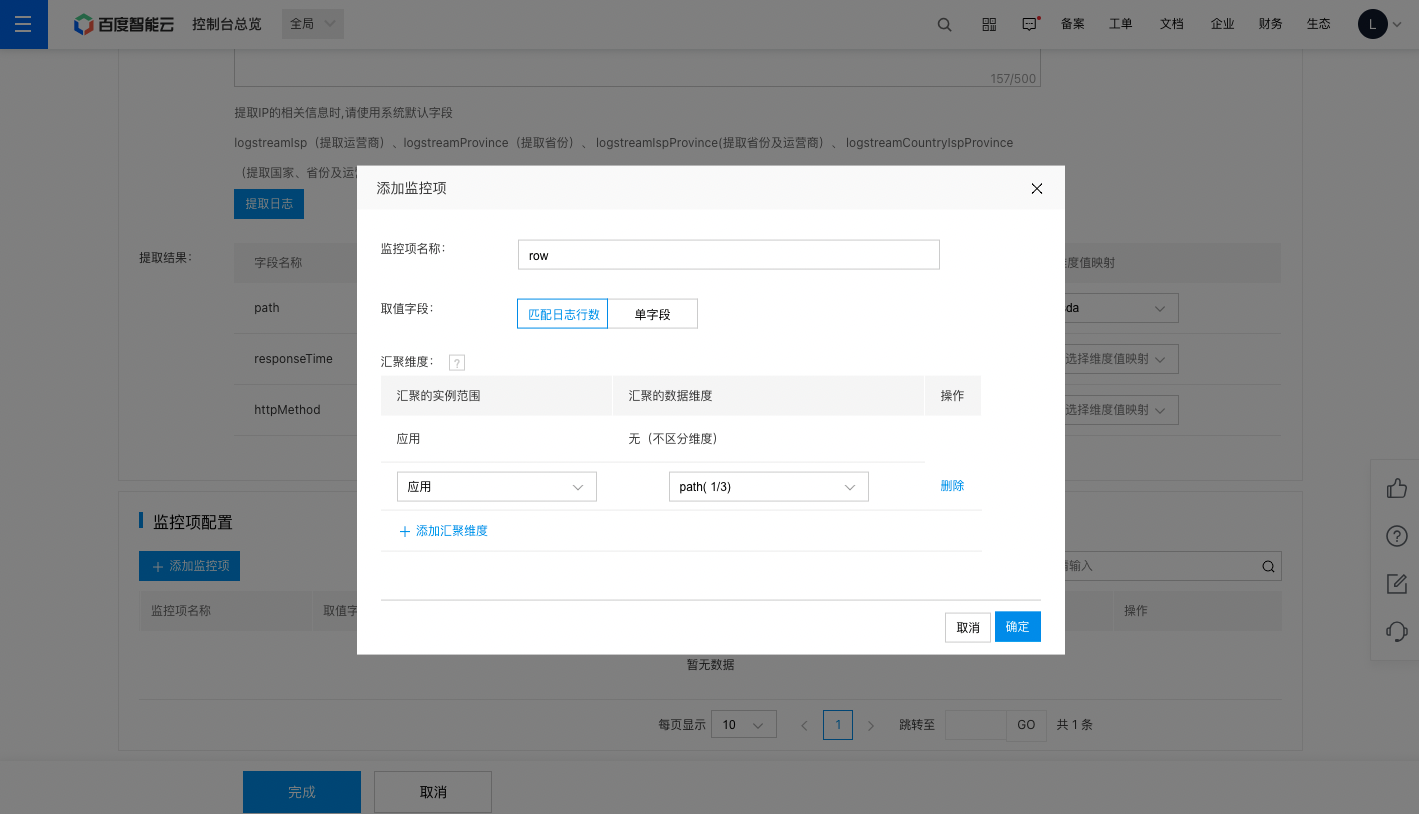
Step 3: Go to the metric configuration section and click "Add Metric" to open the configuration window.
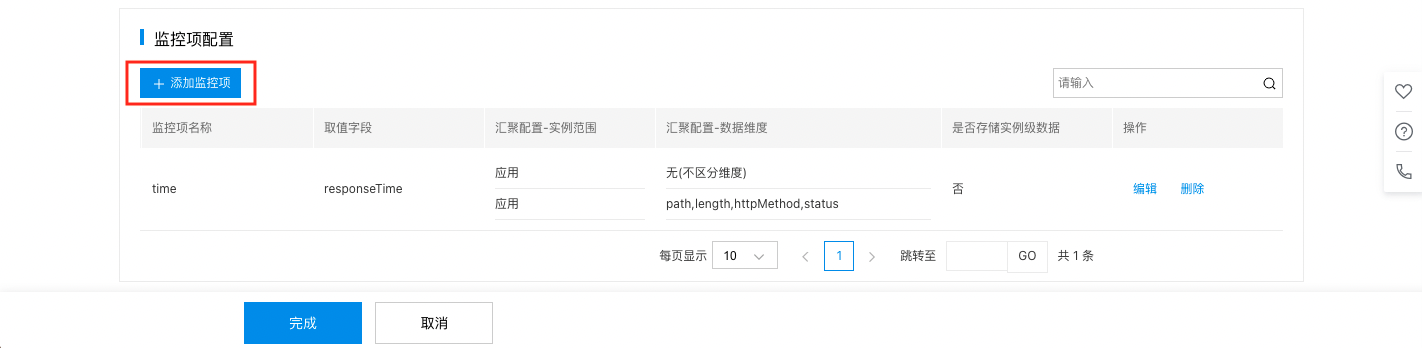
Step 4: After filling out the form, click "OK" to finalize the addition.
Log monitor configuration:
| ConfigMap | Description |
|---|---|
| Collection Period | Users can choose from the following collection intervals as needed: 1 minute, 5 minutes, or 10 minutes (second-level monitoring is already supported). |
| Log path | Enter the absolute path of the monitored log (up to 4096 characters). Example: /home/work/app/services/log/access.log supports time-variant log paths with date command's standard output format symbols and four delimiters (. : _ -), e.g., daily segmented logs: /home/work/apache/logs/access_log. %Y-%m-%d |
| Log extraction rate limit | Choose the data extraction rate per second based on your needs, supported within the range of 1Mb/s to 10Mb/s. |
| Log Sample | You can copy a segment of a log as a sample to verify the accuracy of the log extraction rules (limit: 100 lines or 10,000 characters). |
| Extraction rules | 1. Enter a regular expression to extract log fields (limit: 500 characters). 2. When extract the IP corresponding information, please use these system default fields: logstreamIsp (ISP), logstreamProvince (province), logstreamIspProvince (province & ISP), logstreamCountryIspProvince (country, province & ISP). 3. Note: After entering the extraction rules, the Extract Log button becomes available to extract current log samples for subsequent metric configuration. The button cannot be clicked if you have not entered the log sample or extraction rules. |
| Extraction Result | 1. Field name: The field (key) extracted from the regular expression. 2. Value: The value of the field extracted by regular expression (value). The line number of the source log for each value is displayed before the value, facilitating real-time comparison and verification. 3. Whether can be used as a metric value field: Numeric types default to "Yes", otherwise "No". 4. Enable dimension value mapping: You can choose whether to "translate" dimension values based on your requirements. Each field can only select one dimension mapping table. 5. Add dimension mapping: For details, refer to Dimension Mapping Table |
| Metric configuration | 1. Metric name: Enter the metric name. Metric names cannot be duplicated in the same application. 2. Value field: It is used as the metric field, supporting two configuration methods: matching log line count (default) and single field (selectable Metric value fields derived from extractable field names in the first step). 3. Aggregation dimension: You can add aggregation dimensions to view monitor data within specific dimensional scopes. For example: The average availability of sub-data centers under an APP. A metric can have multiple aggregation dimensions to be added. |
View log monitor data
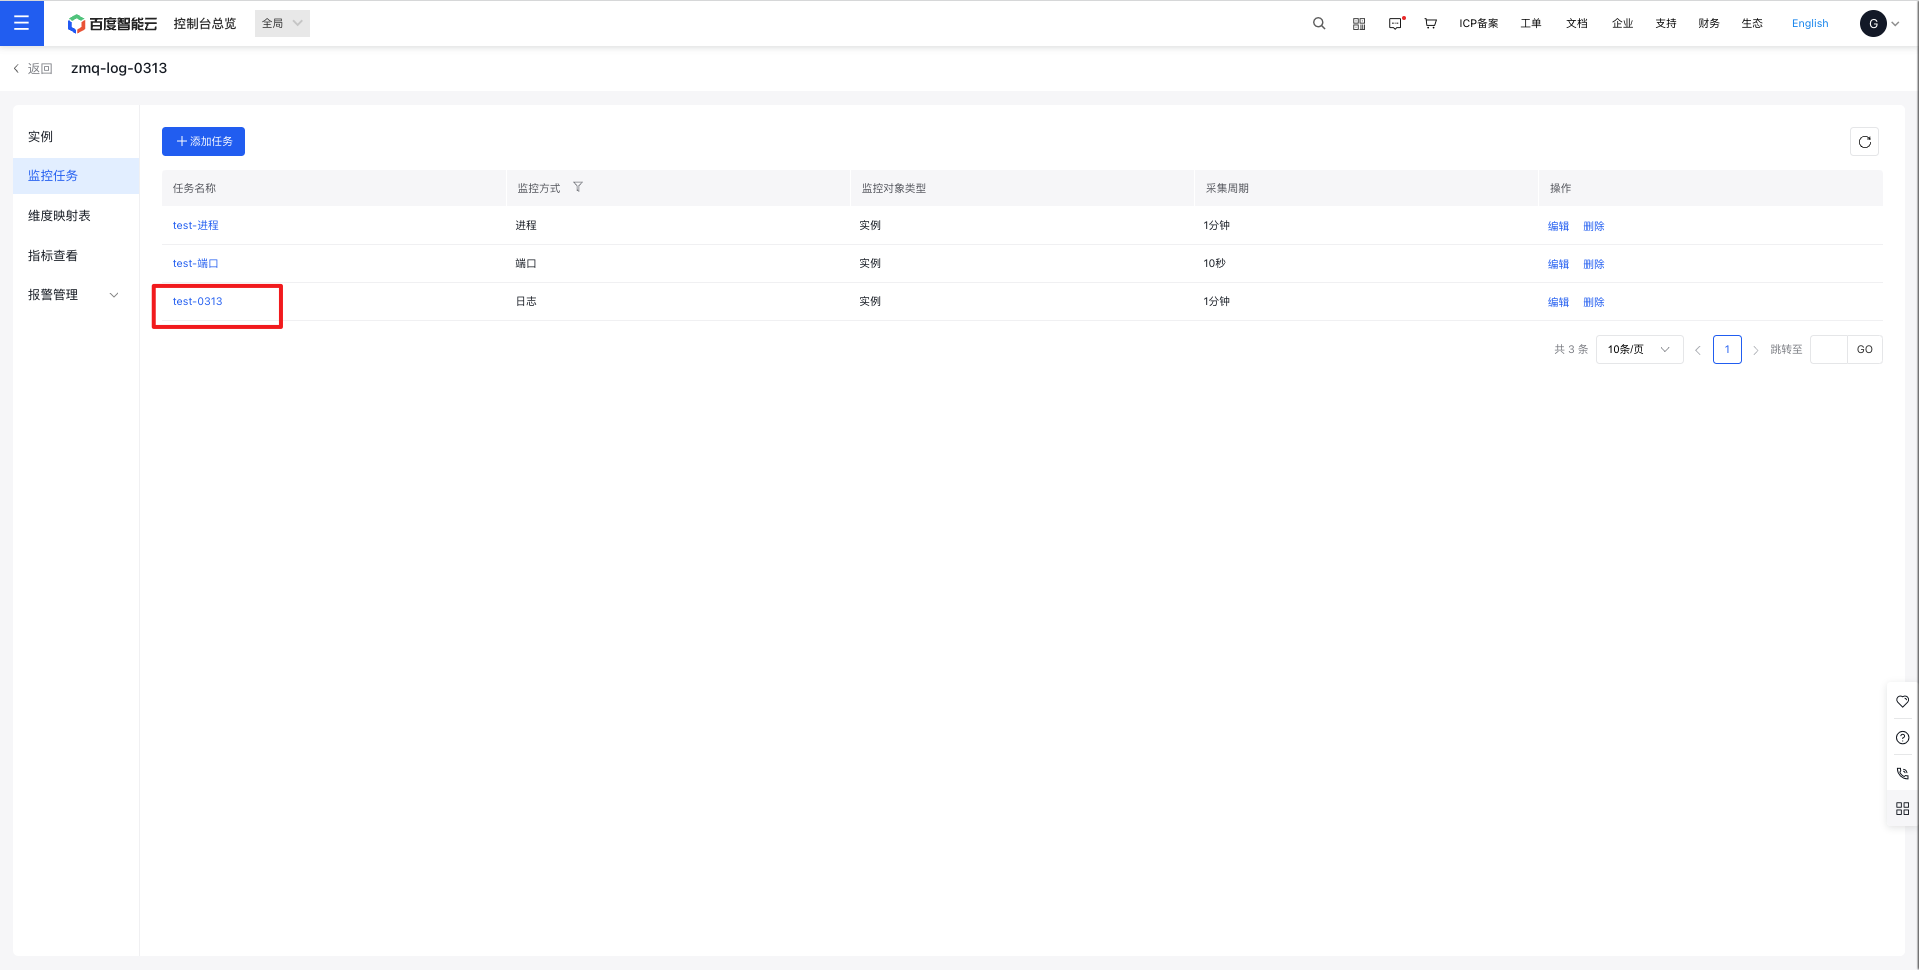
- Go to the Application List page, then click an application name to open its Details page.
- In the left navigation panel, click on the Monitor Task tab to navigate to the Monitor Task page.
- On the "Monitor Task" page, click the name of a monitoring task to open its corresponding "Details" page.
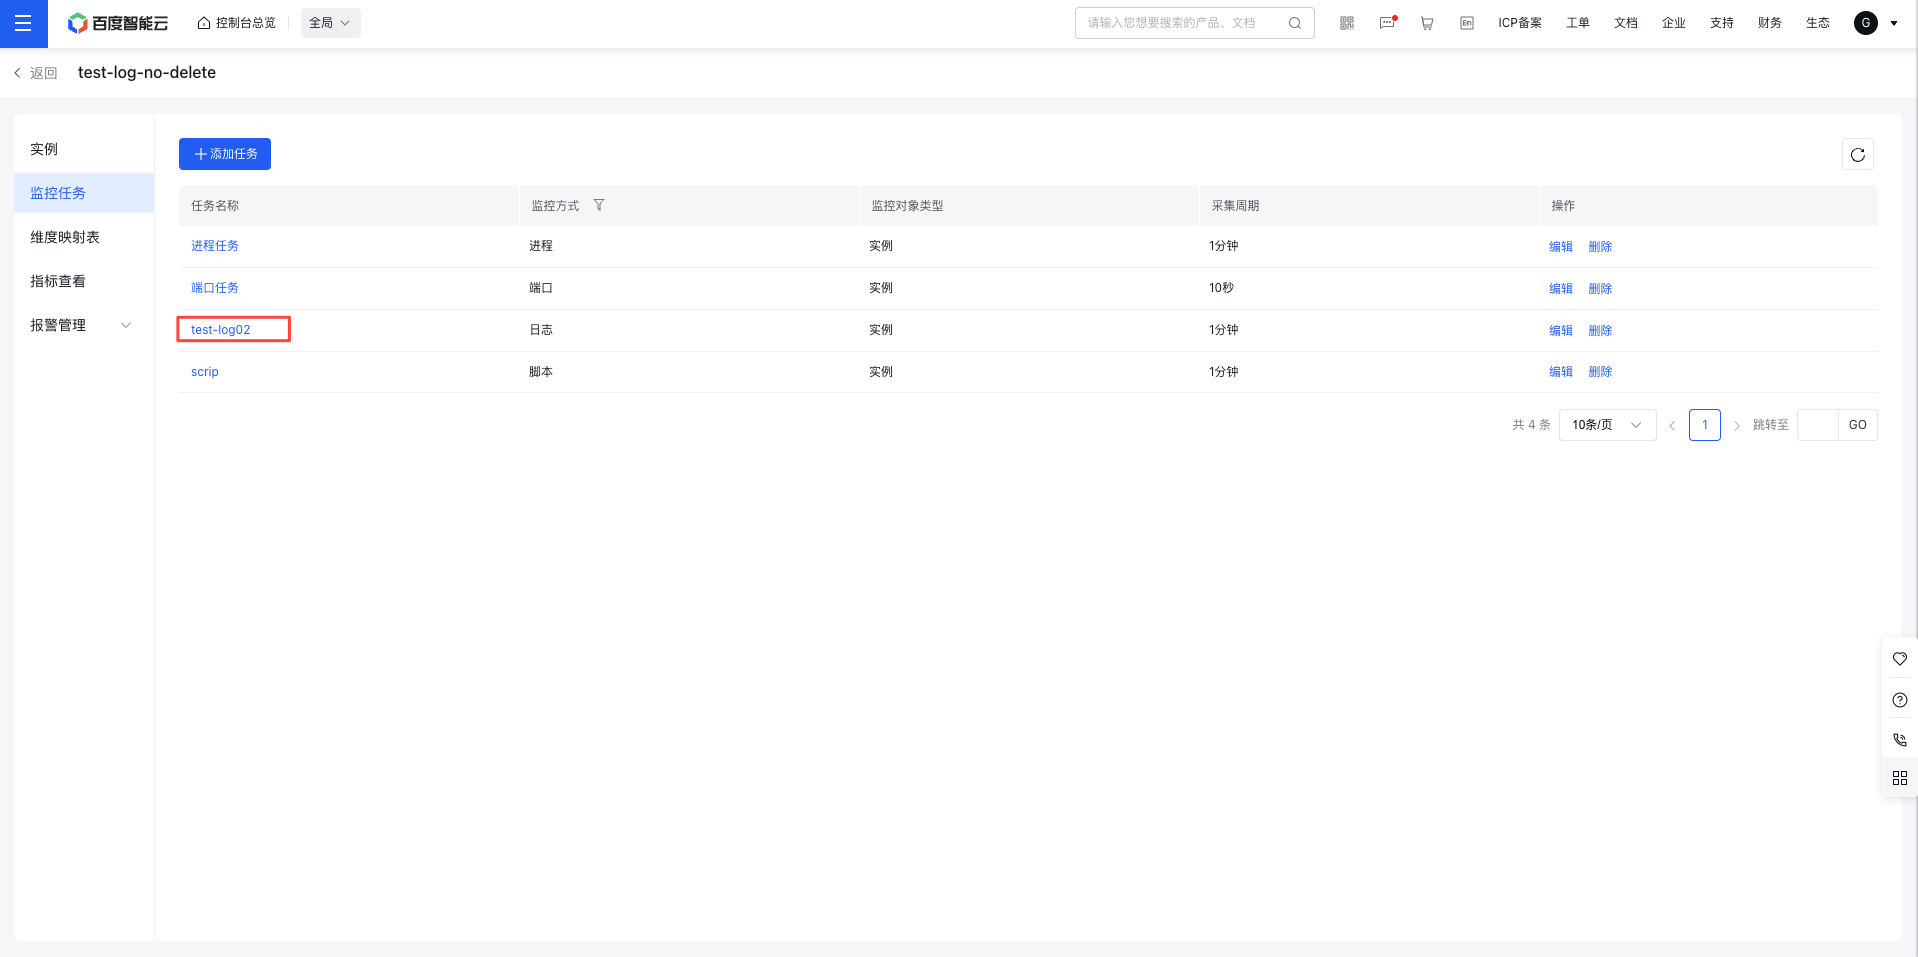
- Check the monitoring data for the task on the corresponding Details page.
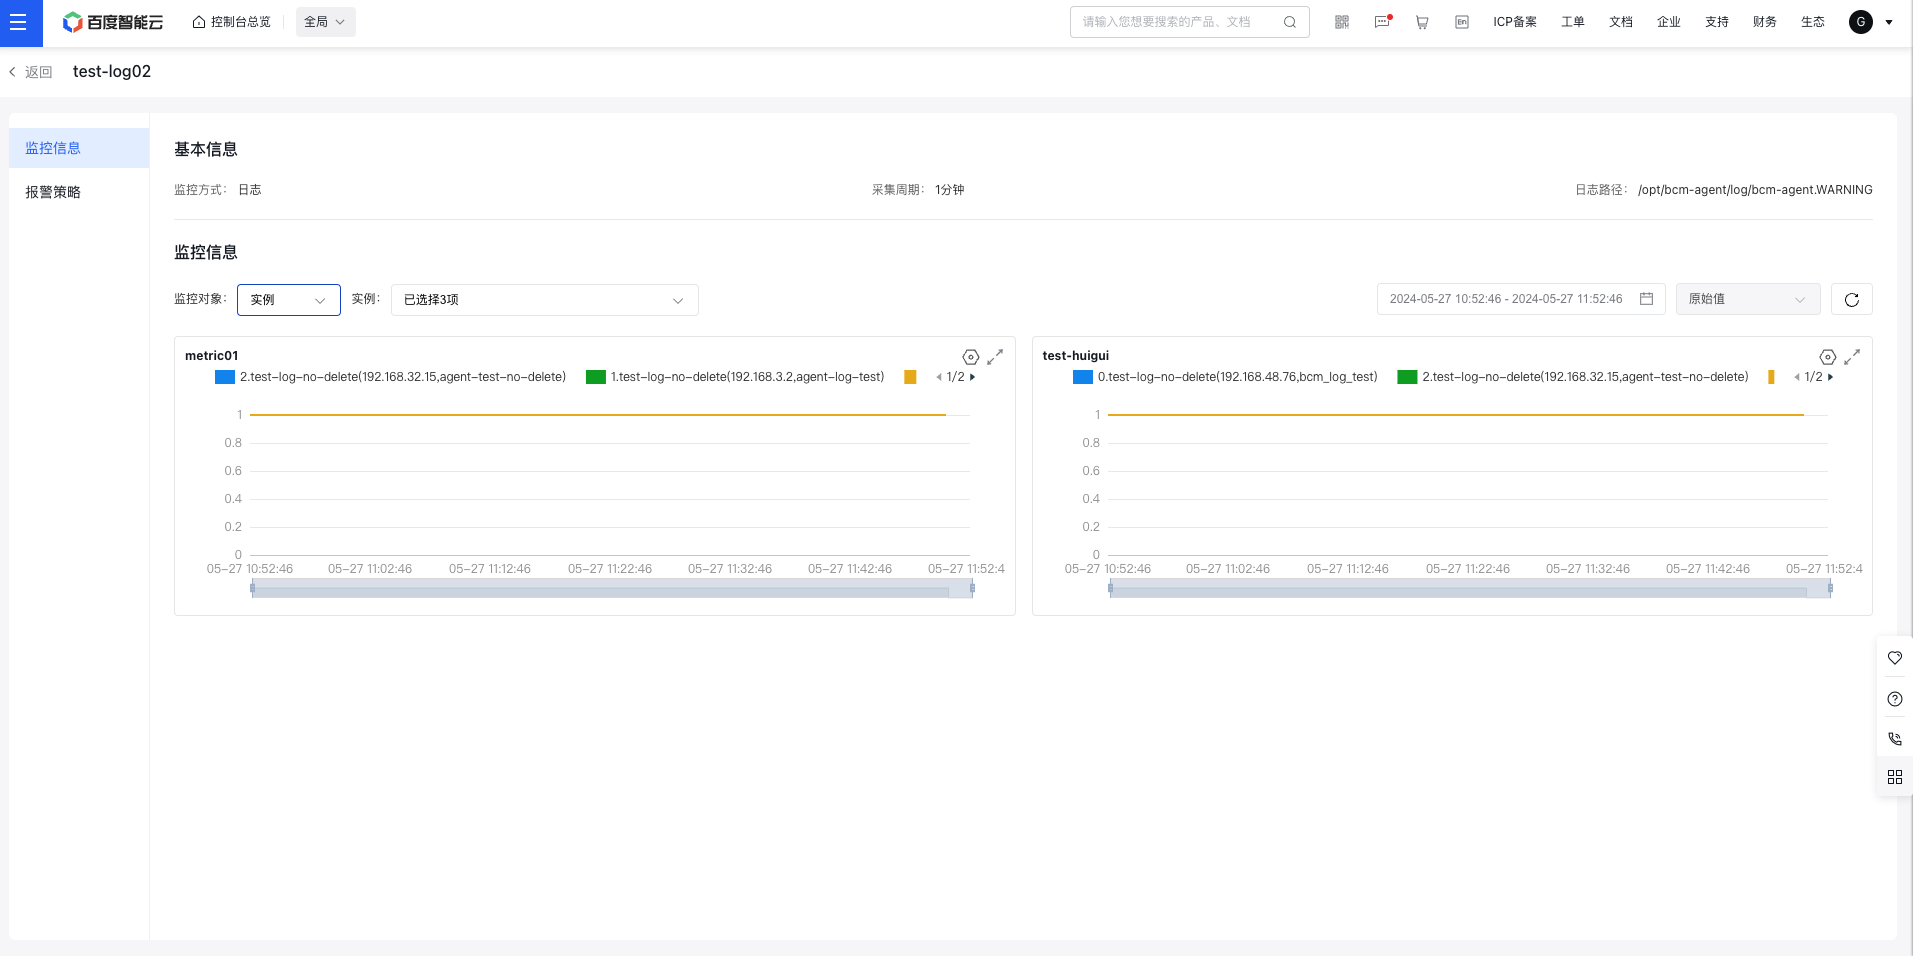
Monitor information page description:
- Monitor object: Provide two options: application (default) and instance.
(1) Instance: Instances can be multi-selected via a dropdown, displaying all instances under the application. By default, the first 5 instances are selected (if fewer than 5, if there is only one instance, then only that instance is displayed). Up to 20 instances can be checked.
(2) Application: Display the metric trends of current applications, with the application names on the horizontal axis, and aggregates metrics by switching statistical methods. - Trend chart dimension: By default, the trend chart displays all monitor data curves for this metric (i.e., data curves without distinguishing dimensions). You can click Settings to select the monitor aggregation dimensions you have added and view the aggregated data curves.
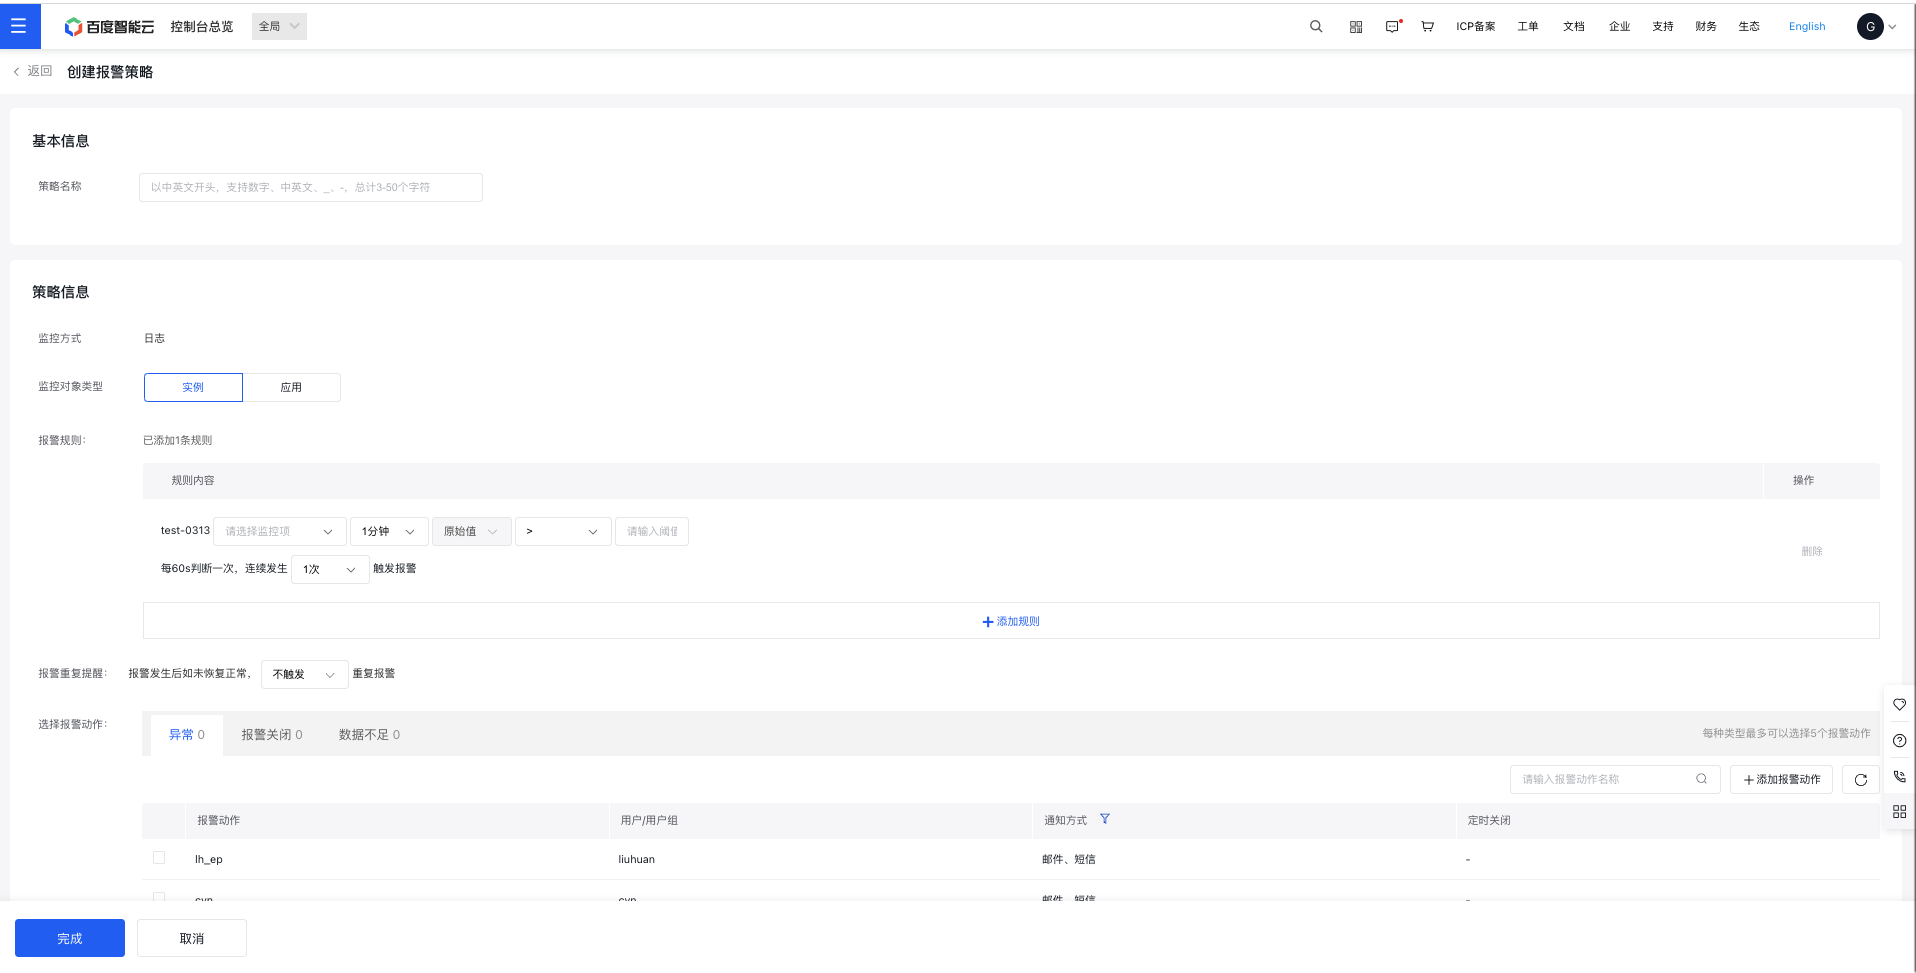
Configure alarm strategy for log task
- Go to the Application List page, then click an application name to open its Details page.
- In the left navigation bar, click the "Monitor Task" tab to open the "Monitor Task List" page. Then, click the name of a log monitoring task.
- Go to the "Log Task" page, select "Alarm Strategy," and view the list of alarm strategies for the current log task. Click "Create Strategy" to establish a new alarm strategy for the task.
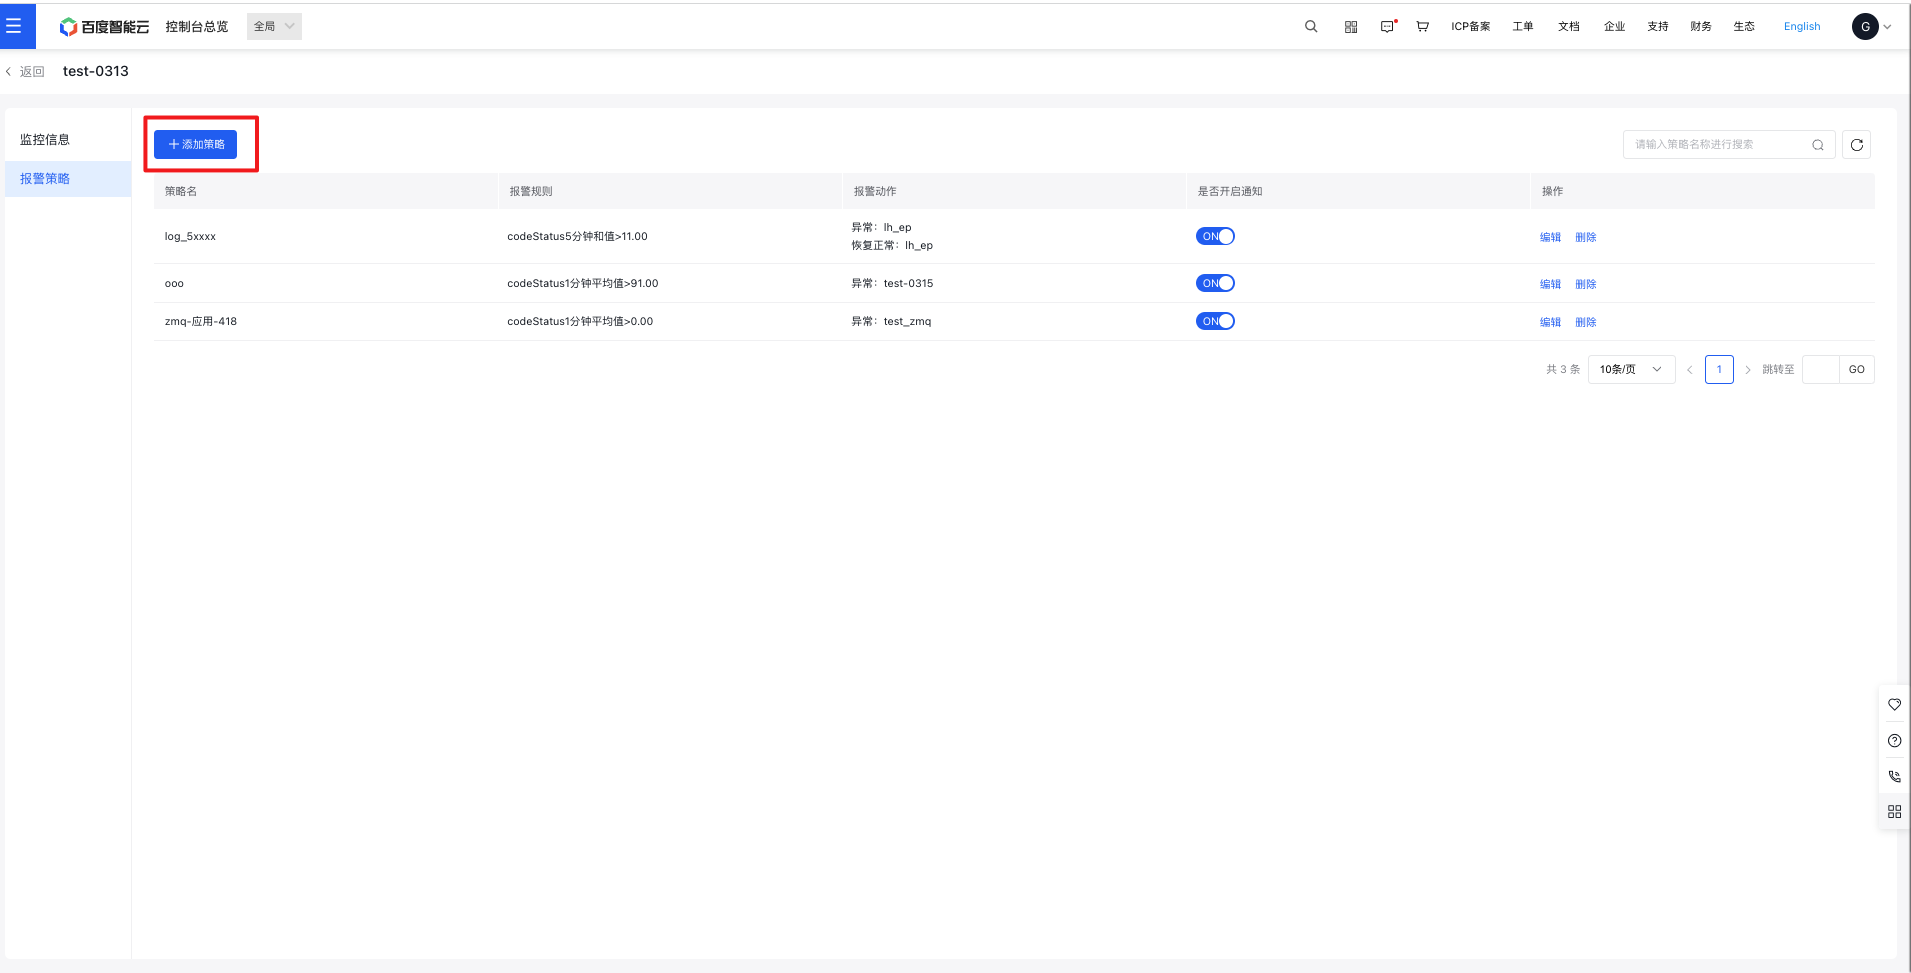
- Complete the alarm strategy configuration form and click Save to finish creation