
Call chain analysis
Last Updated:2025-11-14
Function overview
LLM-called chain analysis supports multi-dimensional trace retrieval and analysis across applications. On the Called Chain Analysis page, you can examine the time taken by different spans in the large model trace, along with associated information, such as input, output, token usage, and more.
Traced call chain list
- Log in to the Baidu AI Cloud console.
- In the left navigation bar, click LLM Application Performance Monitor, then Call Chain Analysis, and select the target region at the top.
- Specify query criteria in the search dropdown and define the desired time range using the time selector in the top right corner.
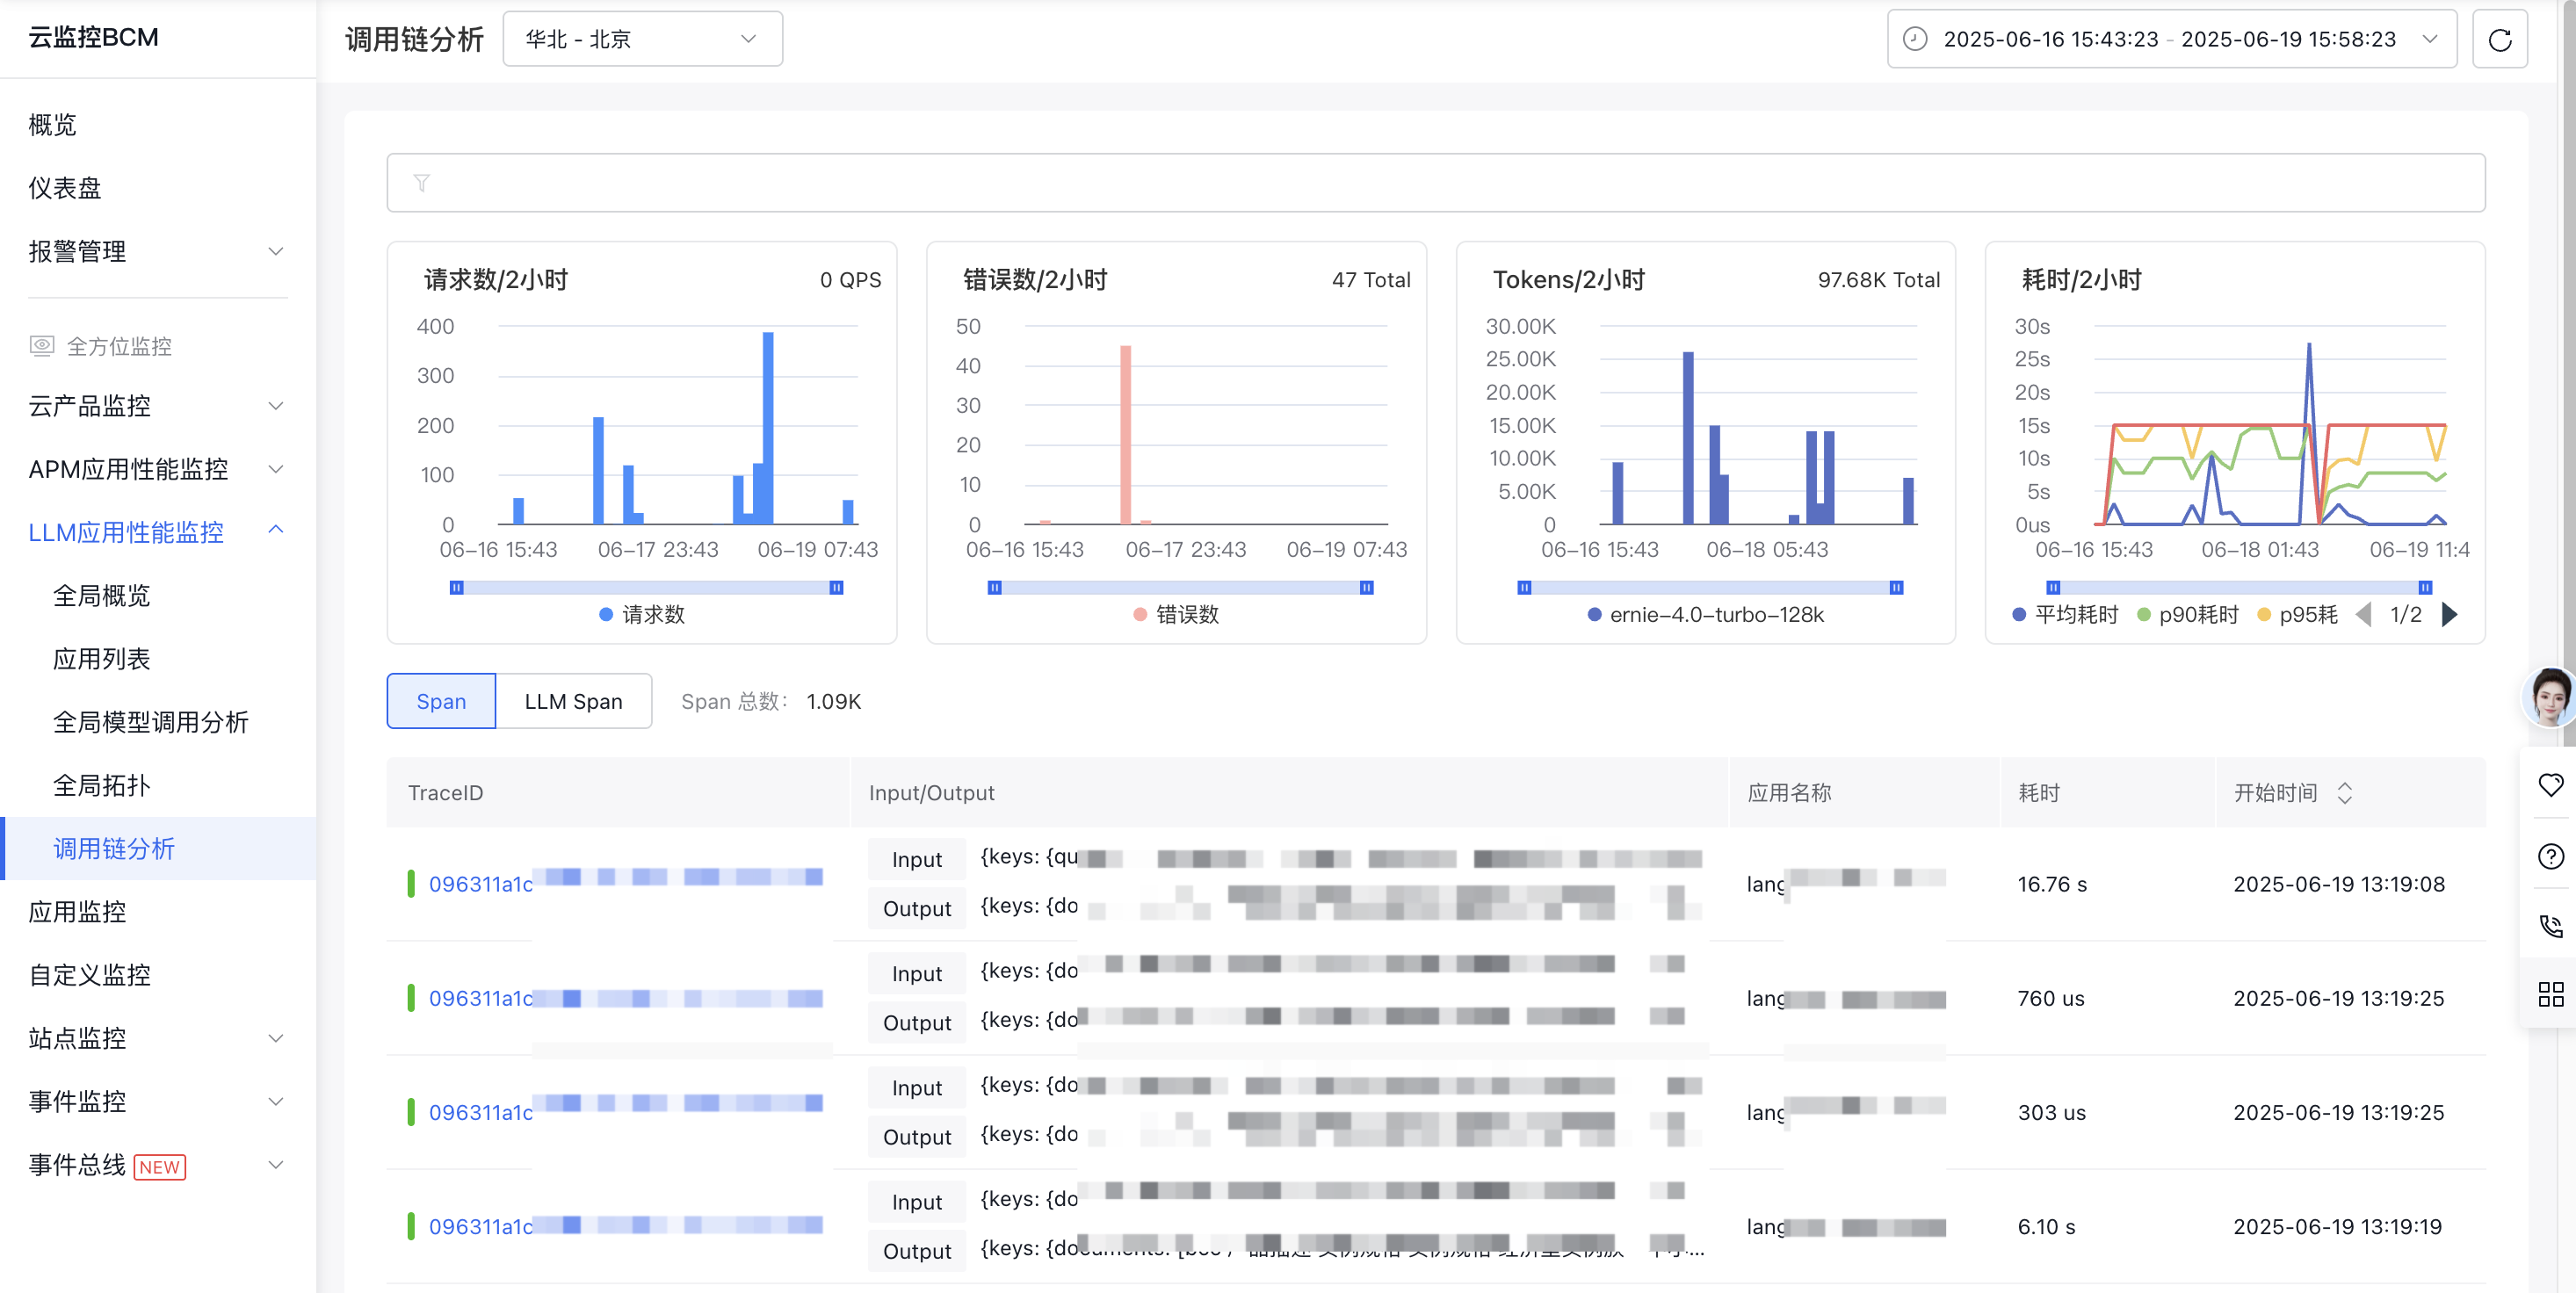
| Filter fields | Description |
|---|---|
| Application name | Only single selection is supported. |
| API | The API name called by an application, which can be manually entered, supports only a single query at a time. |
| Span type | Only single selection is supported. LLM, Workflow, Agent, Tool, Task, Embedding, and Rerank are all supported. |
| Response time | Call chain latency can also be manually entered. For instance, "200-300" filters for call chains with response times between 200ms and 300ms. |
| Model name | Supports single selection and filtering of calls by the name of the large model. |
| Status | Indicates whether the call was successful. An error is flagged if an exception is returned, span.statusCode is set to Error, or the value of span.attributes.http.response.status_code is 400 or higher. |
| TraceID | It can be manually entered, with support for only single value queries at a time. |
| Advanced query | Allows querying of additional call attributes. When entering query conditions, precede them with "attributes." For instance, to filter calls with exceptions, enter "attributes.has_exception" in the query condition field and "true" as the value. |
Traced call chain details
- Log in to the Baidu AI Cloud console.
- In the left navigation bar, click LLM Application Performance Monitor, then Call Chain Analysis, and select the target region at the top.
- Specify query criteria in the search dropdown and define the desired time range using the time selector in the top right corner.
- Each row in the query results represents a span. Click the corresponding TraceID to open the "Chain Details" page.
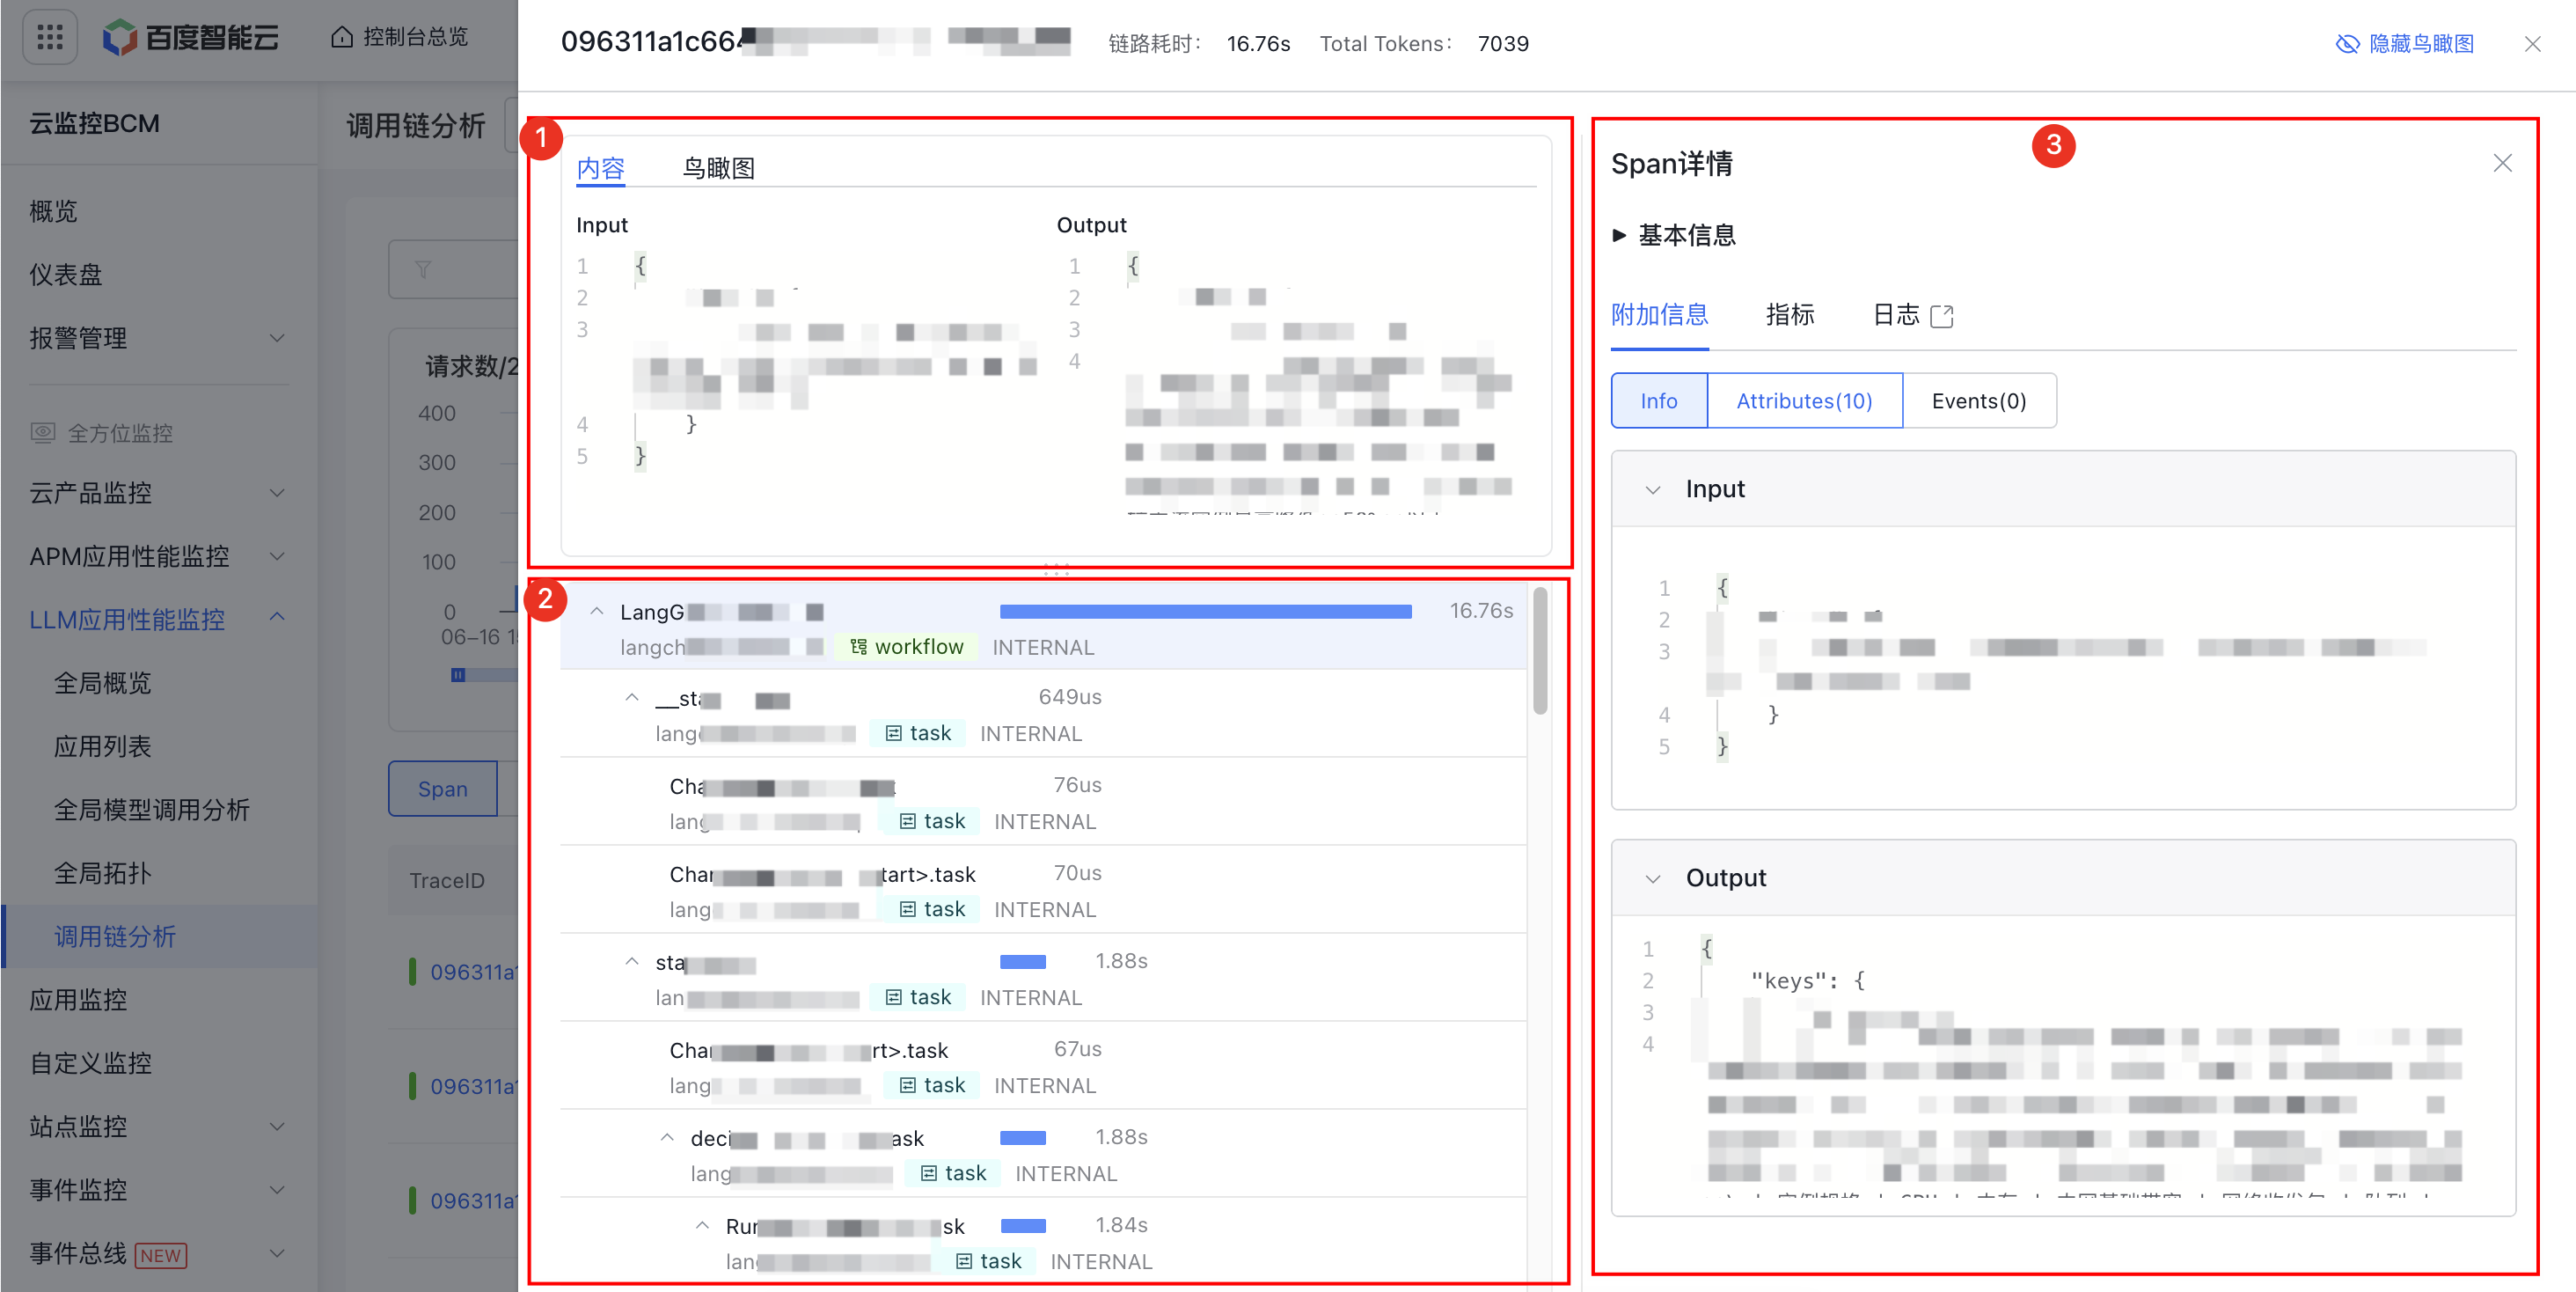
Capability description
Module 1
- By default, displays trace input/output information, with an option to switch to an aerial view.
- The aerial view shows the latency distribution of spans in the entire call chain. In the top right corner of the page, you can switch between "Hide" and "View" for the aerial view.
- Applications are displayed using different colors, with calls that have exceptions marked in red.
- The timeline visualizes the entire duration of the trace data.
Module 2
- Each row in this section represents span data and illustrates the hierarchical relationship between parent and child spans.
Module 3
- Additional details: Includes Info, Span Attributes, and Events.
- Metrics: Displays metrics related to the span, such as request count, error count, latency, and more.
- Logs: If your application is linked to a log service, click to quickly navigate to the
page in the application details to view service logs corresponding to the current TraceId. - Exception: If a span records exception information, this page will show the specific details of the exception.