
Application list
Last Updated:2025-11-14
Application list
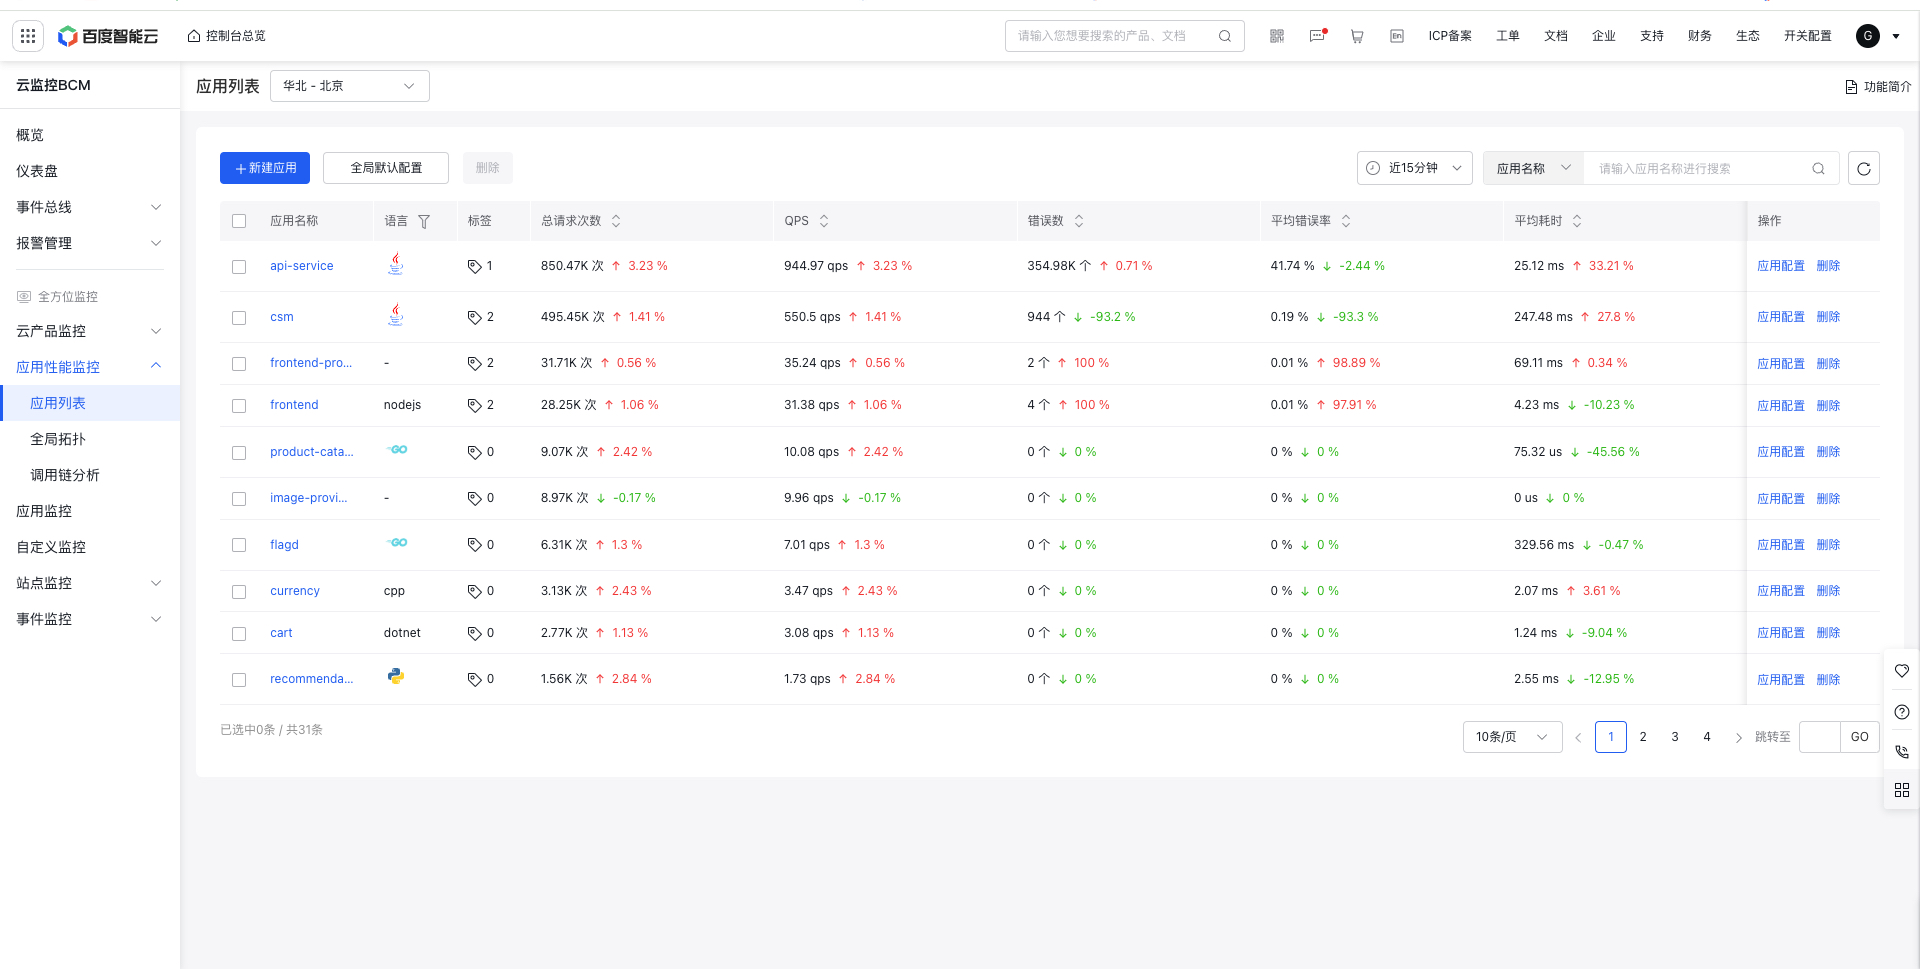
Click on Baidu Cloud Monitor (BCM), select APM Application Performance Monitor - Application List from the left menu, and the list will display all onboarded applications and related request data
Function description:
- List fields: Display application name, language, tags, server-side total requests, QPS, average error rate, error count, and average latency, and support day-over-day comparison
- Application filtering: Filter based on application name and application tags
- Delete application: This action removes the application from the list and clears its configuration while preserving its monitoring data. Are you sure you want to delete "csm"? Note: The application will be recreated once data is reported again! To delete an application, stop data reporting first!
- Edit tags: Associate multiple tags with an application. Tag keys and values are sourced from the unified tag center of Baidu AI Cloud. To manage tags, please visit the Tag platform.
Global application configuration
Global default configurations can be set above the application list. All applications using global configurations will take effect according to the global default configuration

- Storage configuration: Configurable metrics storage period (default 90 days) and Trace storage period (default 30 days), customizable
- API call configuration: You can configure the slow call duration, HTTP error status code filtering, and slow SQL call duration, etc.
- Global topology configuration: Support configuring duration and error rate warning line. Global topology configuration applies to health status displays in global topology

Single application configuration
Click the application configuration behind the application to configure application-related logs, API call configurations, global topology configurations, etc.

- Log association configuration: You can configure the binding between applications and business logs, requiring the configuration of region, logstore, TraceId, and SpanId, etc. Log association configuration can be applied to log association analysis. For details, refer to :Application Performance Monitor→Log Analysis
- API call configuration: You can configure slow call duration, HTTP error status code filtering, slow SQL call duration, etc., which can be applied to slow call statistics, error count statistics, and slow SQL statistical charts in application performance monitor. If the Use Global Configuration switch is turned on, the global application configuration will be used. If it is turned off, the current application's own configuration will be used.
- Global topology configuration: Support configuring duration and error rate warning line. Global topology configuration applies to the display of global topology status. If the Use Global Configuration switch is turned on, the global application configuration will be used. If it is turned off, the current application's own configuration will be used.
- Apply configuration to other applications: Option to one-click apply the current application's configuration to other applications