
Management Dashboard Charts
Basic concepts
| Term | Description |
|---|---|
| Monitor type | Currently supports monitoring for cloud products, applications, custom metrics, and other types. |
| Statistic Method | Configure data analysis methods, including average, sum, maximum, minimum, and count. |
| Comparison based on time period | Compare and display monitoring data from custom time periods alongside current monitoring data. |
| Chart Type | Trend chart, table, dashboard chart, data panel, embedded Website |
| Types | Choose the display type for the trend chart: line chart, bar chart, stacked bar chart, area chart, or stacked area chart. |
| Decimal places | Allows custom configuration for the number of decimal places to display. |
| Unit | Displays the unit of the selected metric; if a unit is not predefined, custom units can be specified. |
| Null value processing | Define how to handle null values in the data. Trend charts support displaying as 0, connecting points, or leaving breakpoints. |
| Threshold | |
| Time Range | Set how chart time corresponds to the dashboard's timeline. The dashboard offers three methods for chart time selection: |
Create dashboard and charts
New chart group
- Select "Dashboard" from the left navigation bar to enter the Dashboard List page.
- Click on the dashboard name to navigate to its details page.
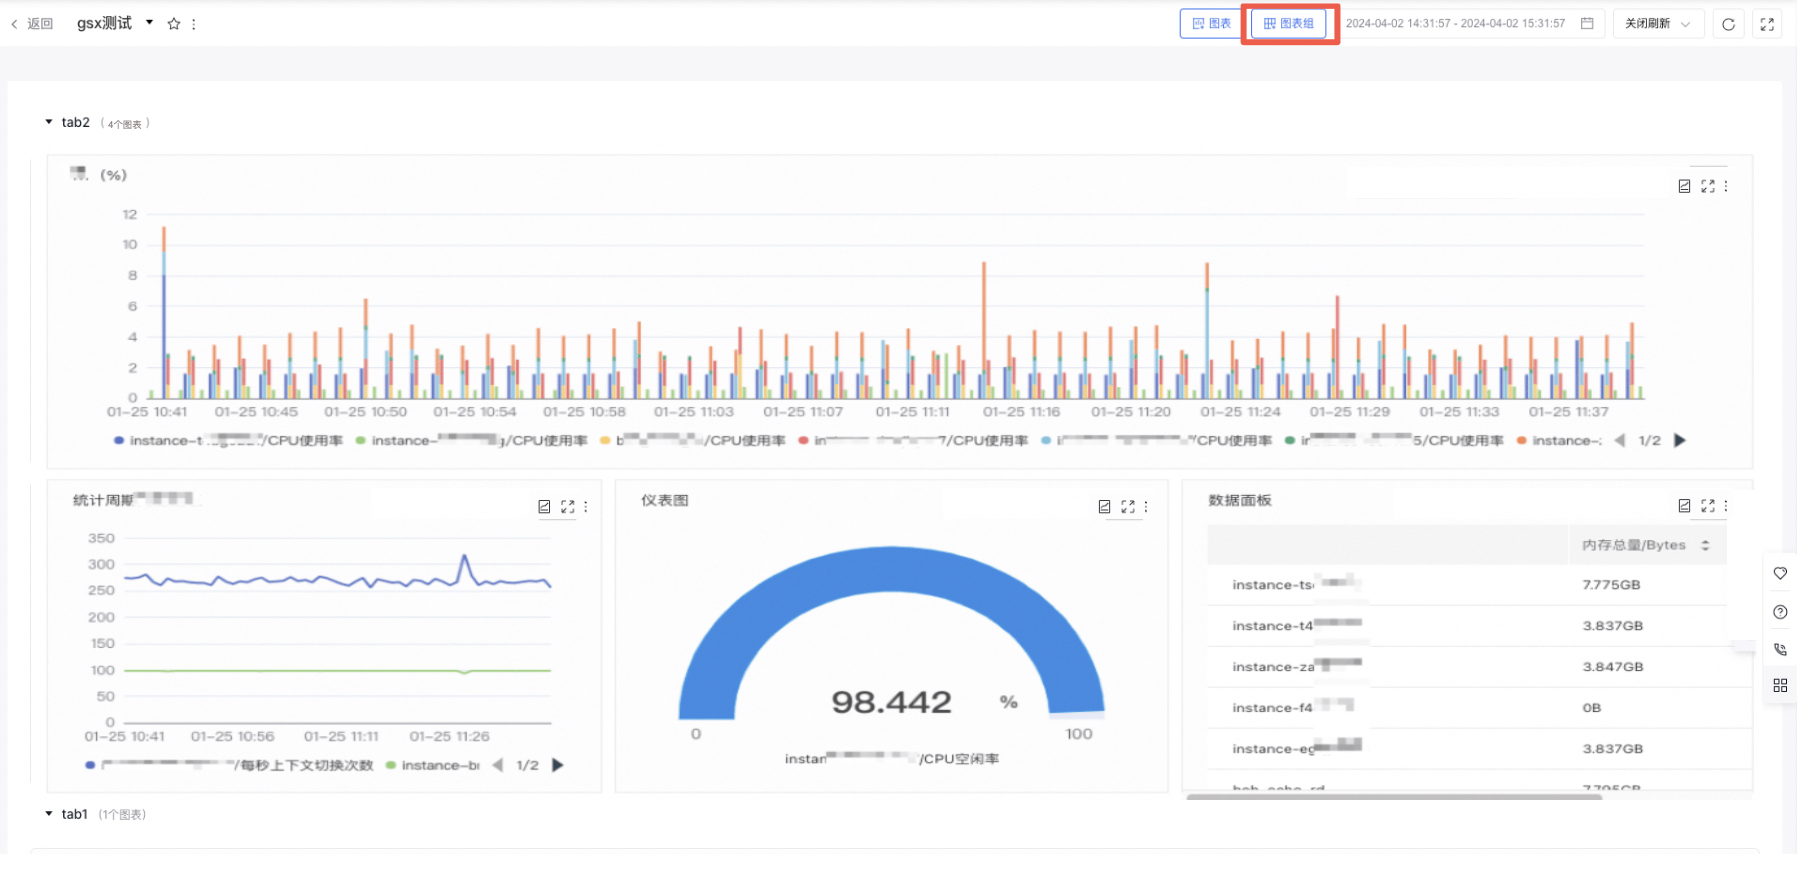
- In the dashboard details page, click the Chart Group button in the upper right to create a new chart group. Redirect to the configuration chart page by clicking the new chart group
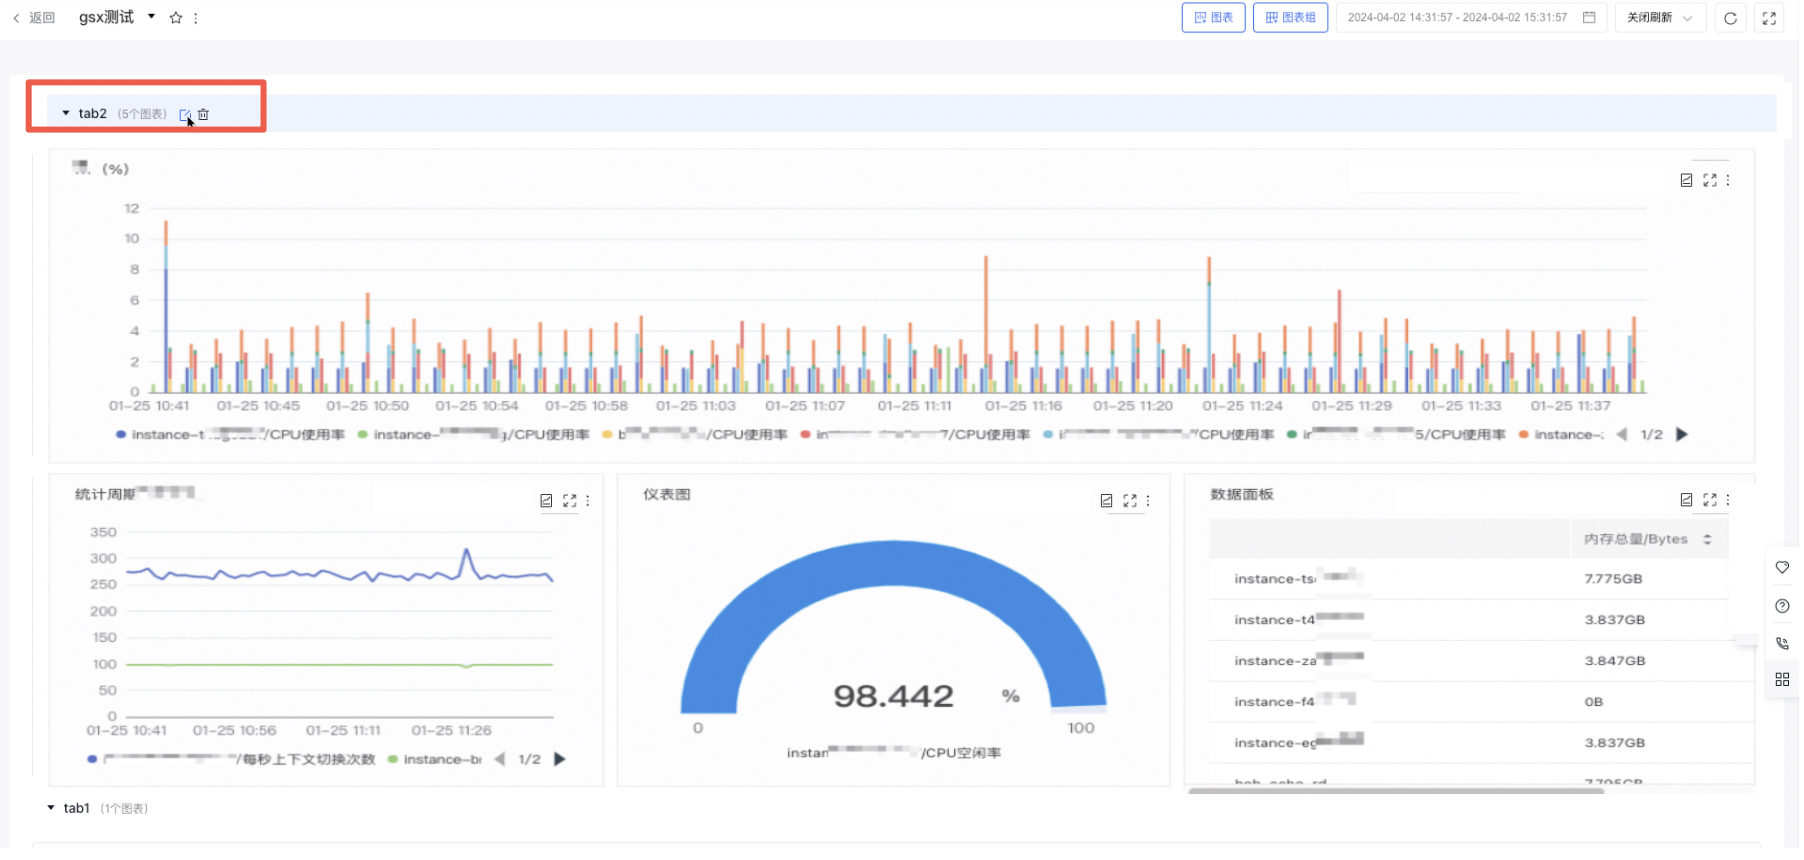
- Hover over a chart group to enable editing or deletion operations; hold and drag the chart group to sort them
New chart
- Select "Dashboard" from the left navigation bar to enter the Dashboard List page.
- Click on the dashboard name to navigate to its details page.
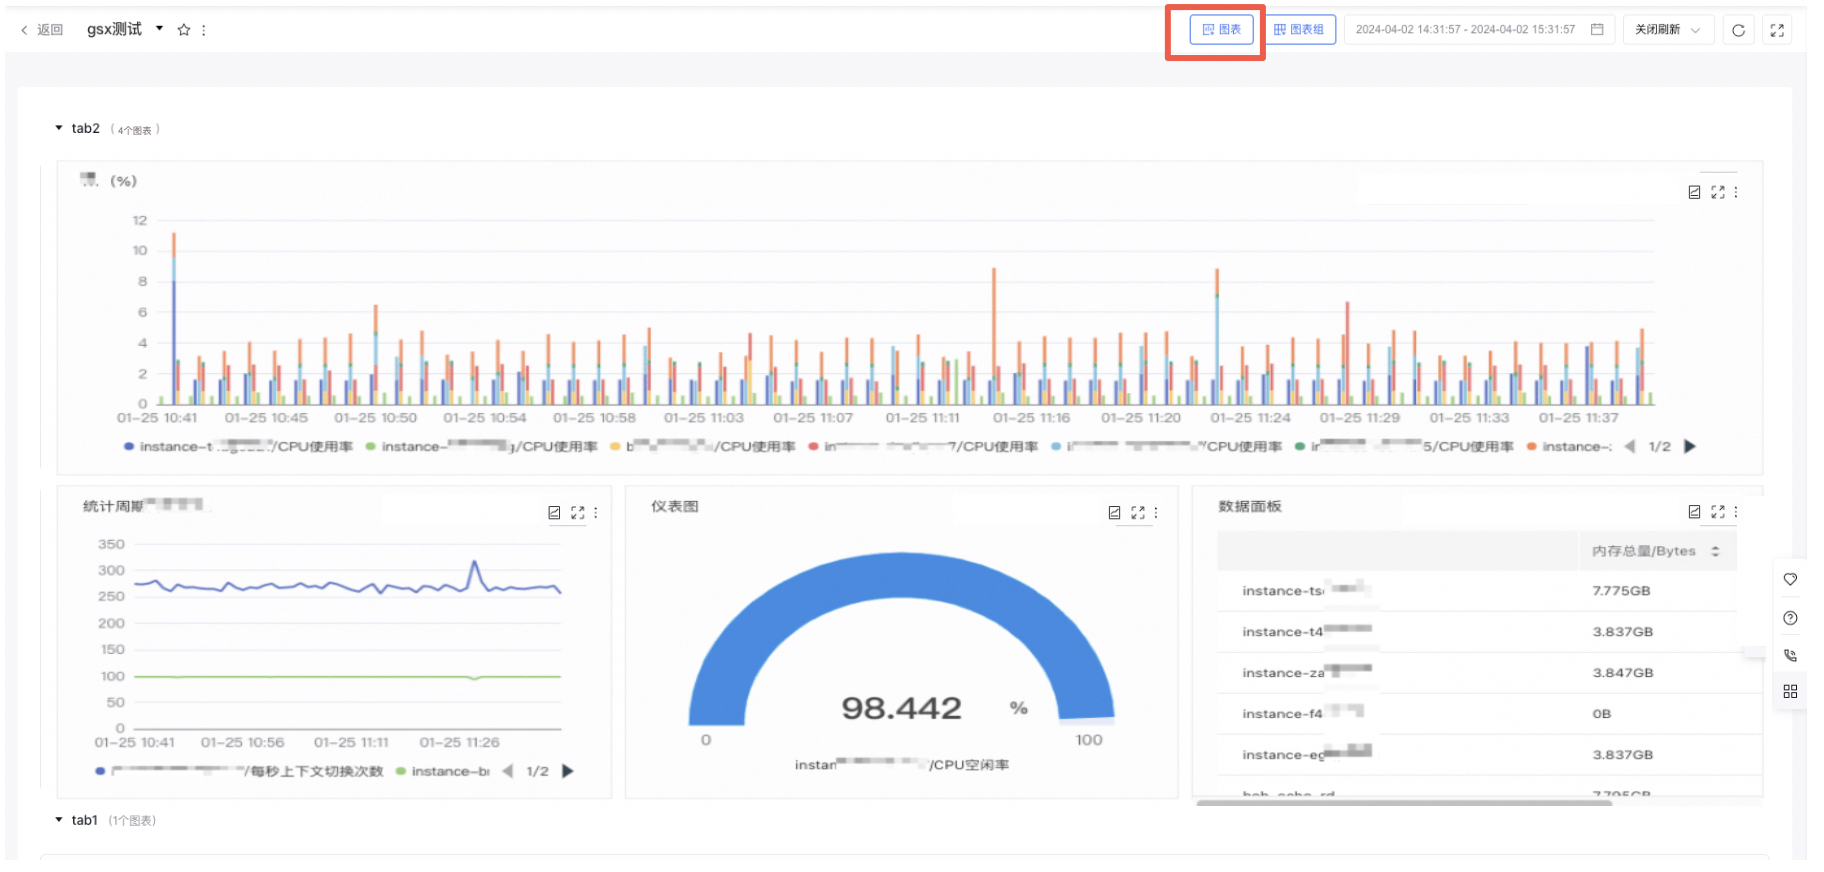
- In the dashboard details page, click the Chart button in the upper right to create a new chart. Redirect to the configuration chart page by clicking the new chart
- Choose the chart type and fill out the related form information.
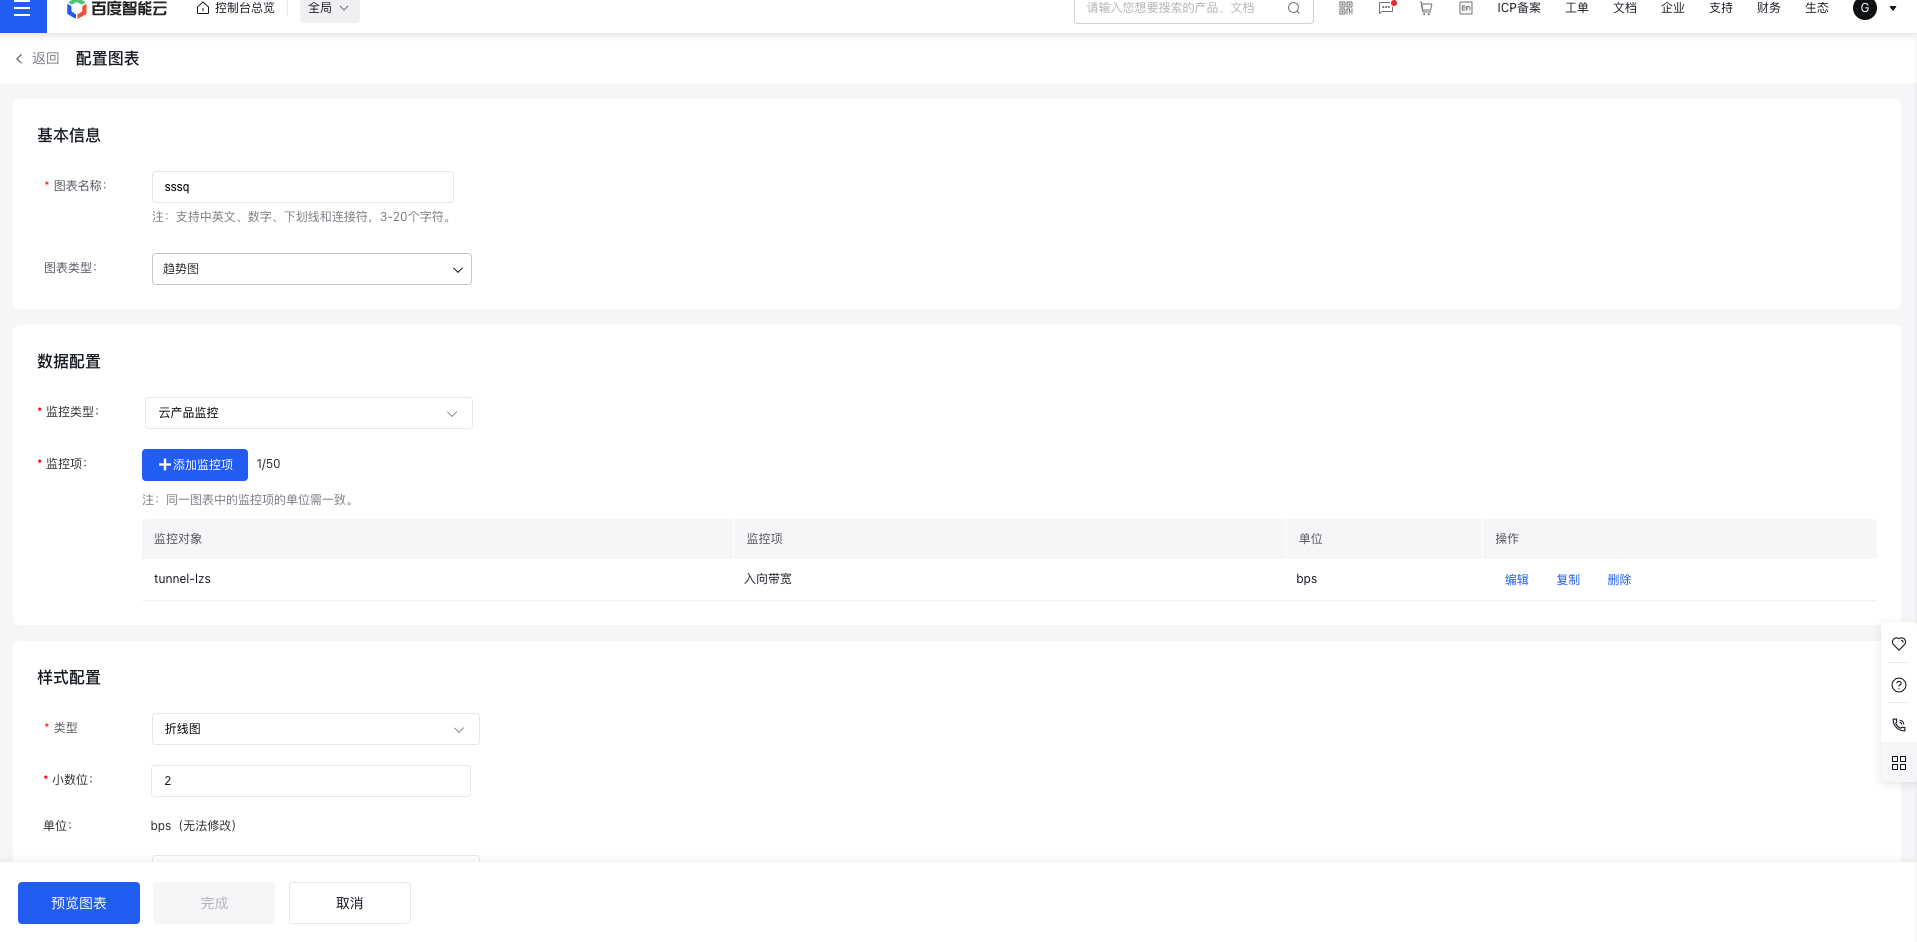
- Trend Chart
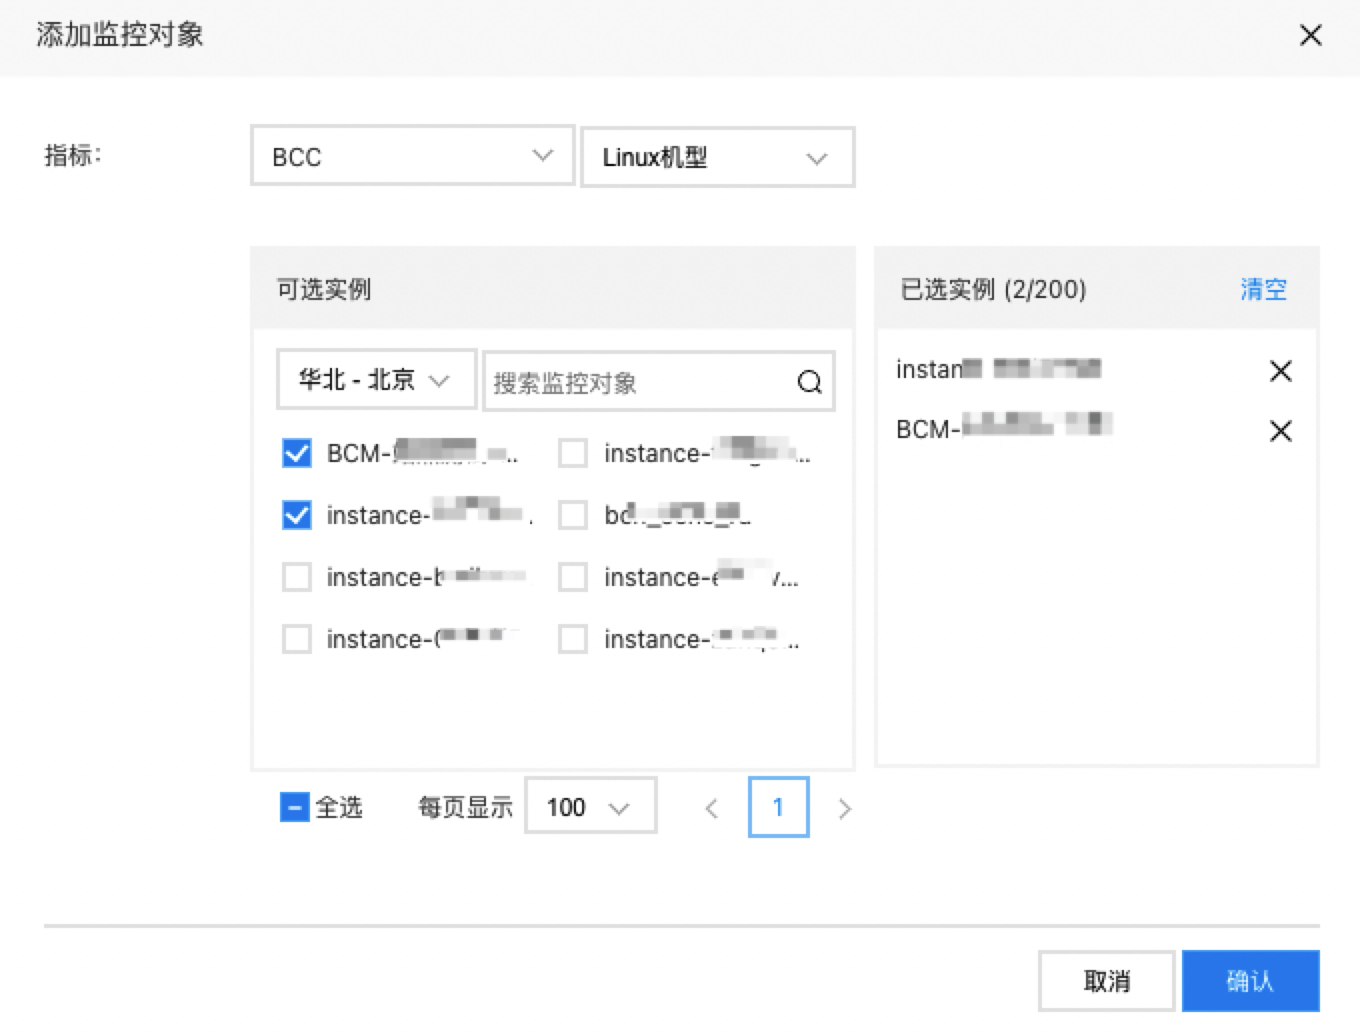
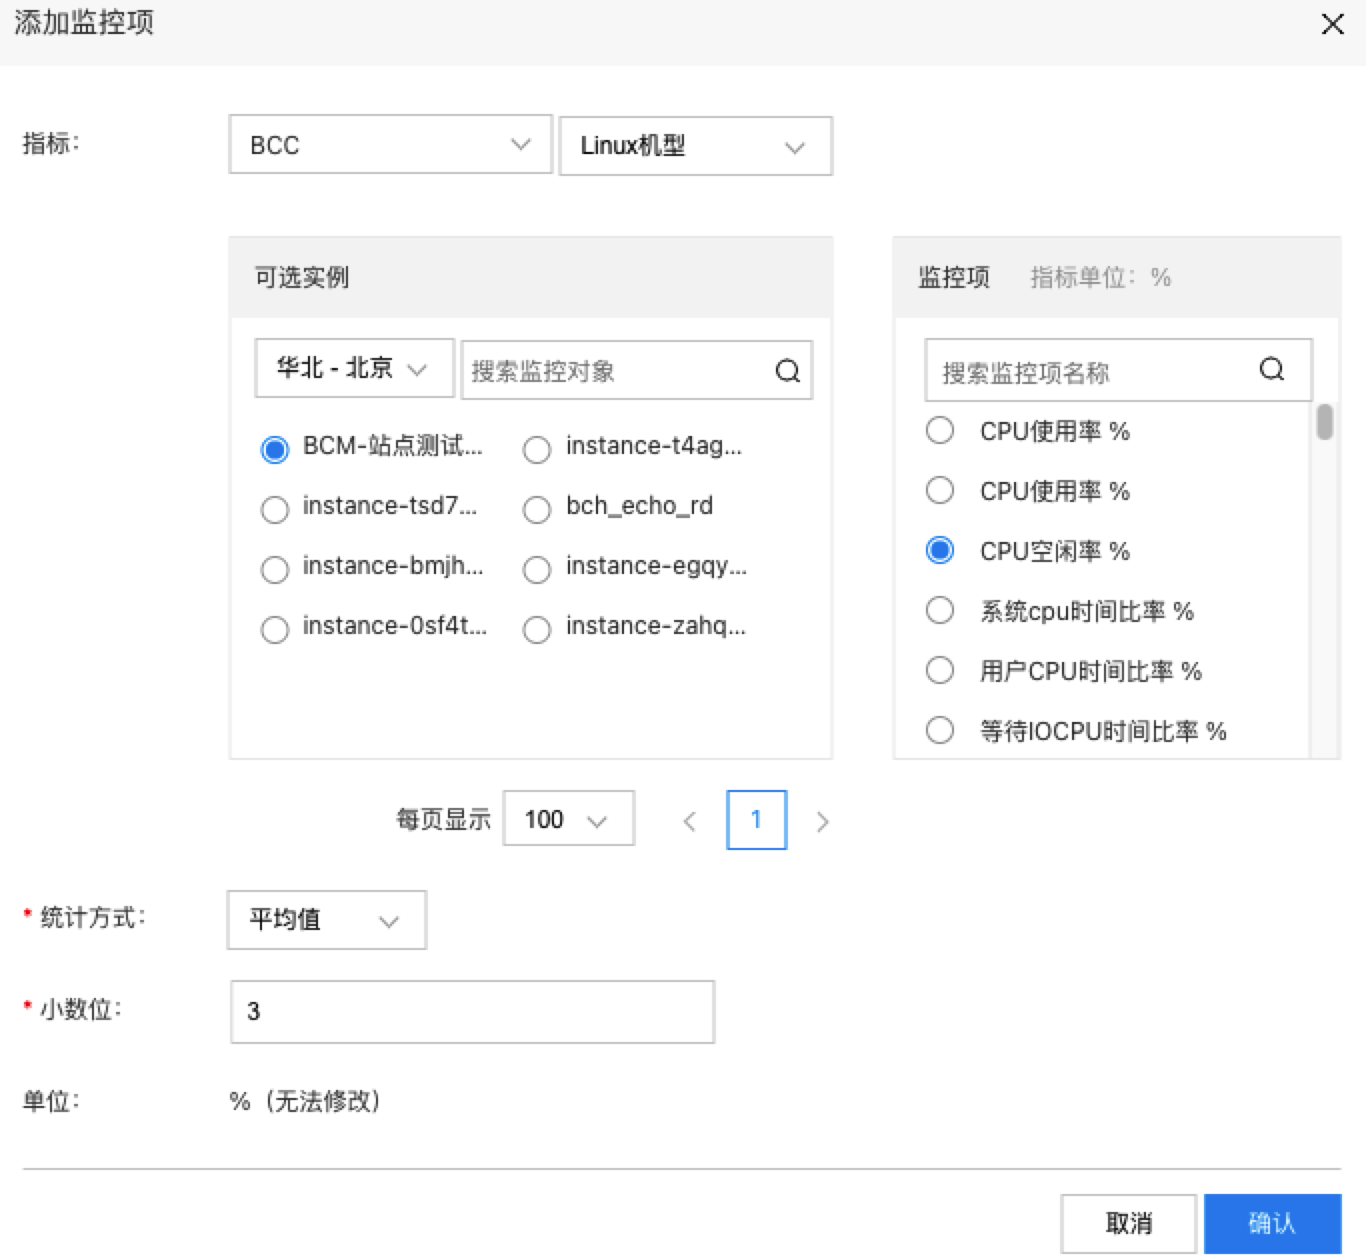
(1) Click the "Add Monitor Object" button to open the corresponding pop-up window.
(2) Select the instances you want to display and click "Confirm" to successfully add them.
Description:
- You can select all instances, with a limit of 200 instances per chart.
- Each chart only supports metrics that share the same unit.
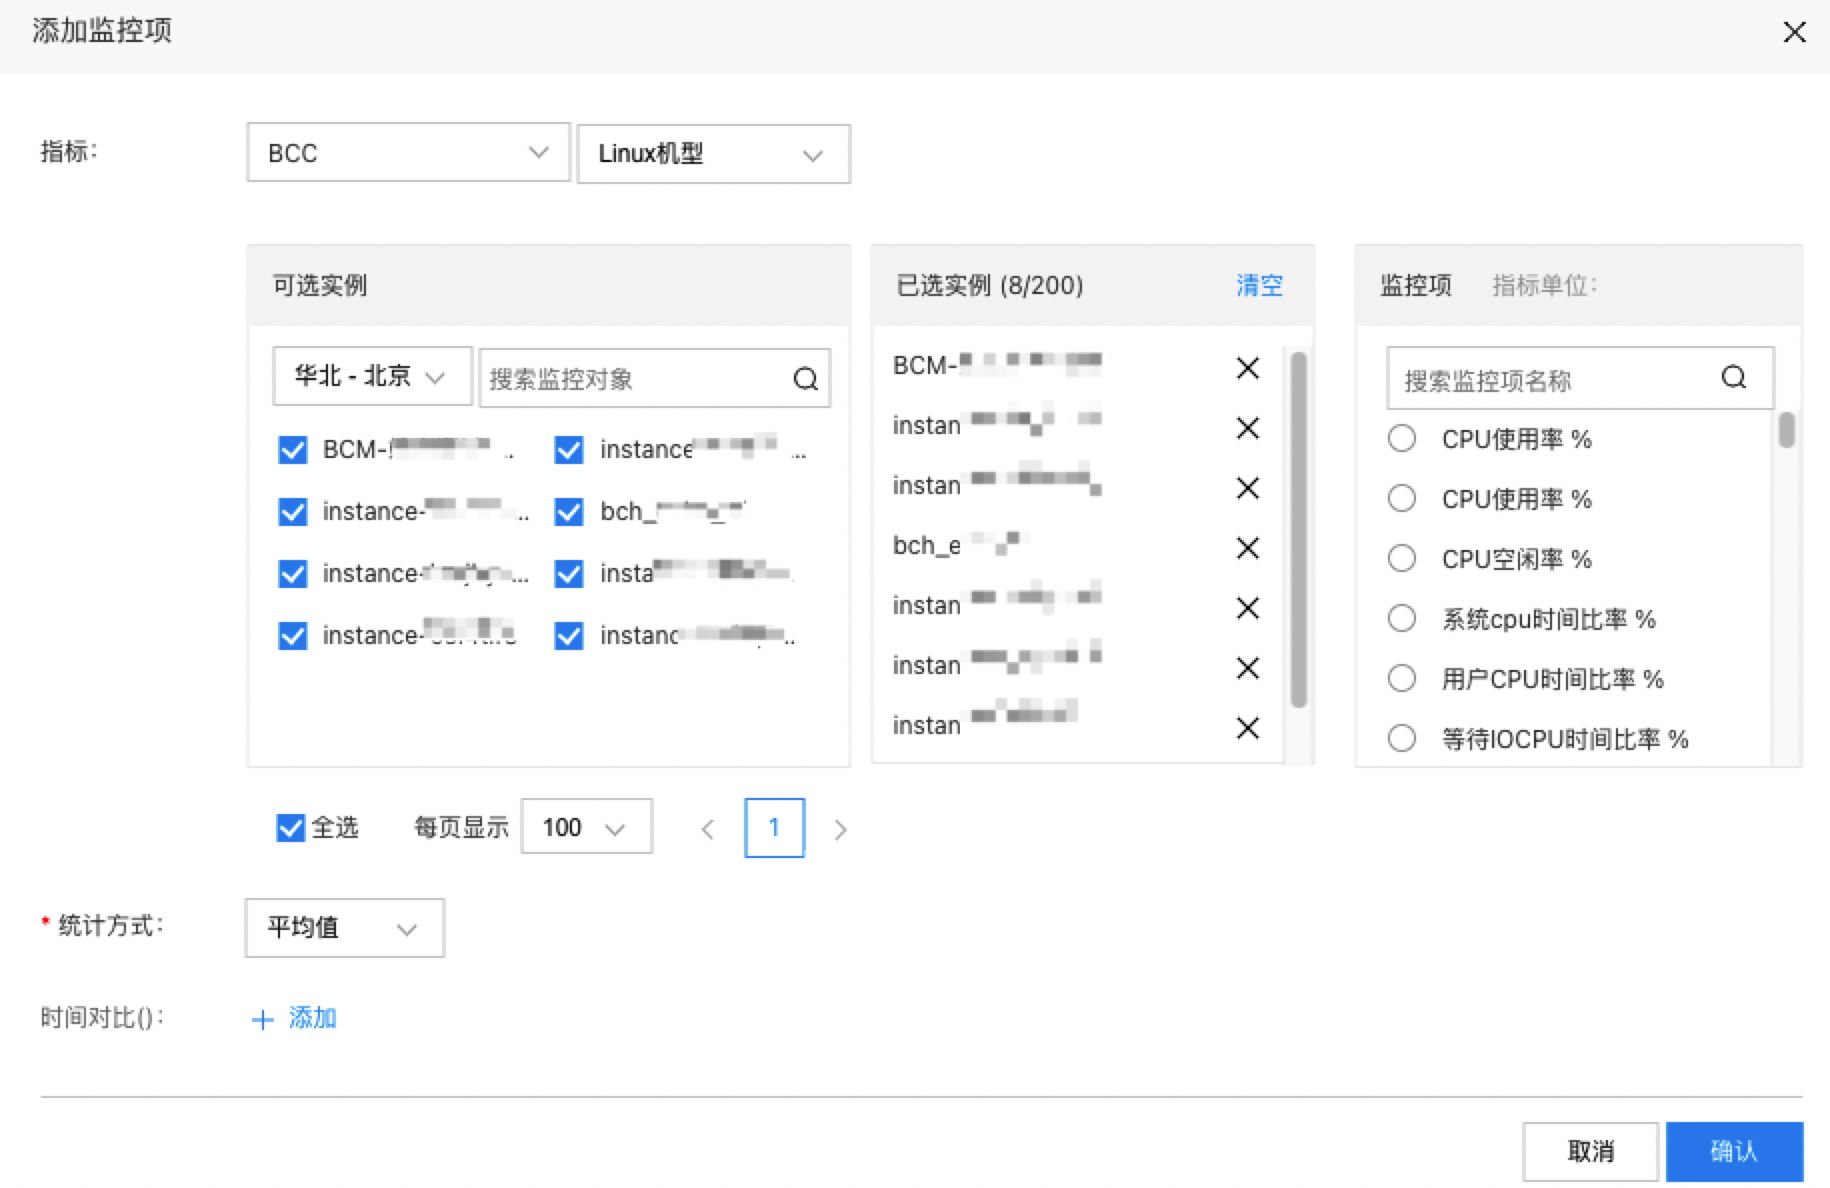
- Table
(1) Click the Add Monitor Object button to open the Add Monitor Object pop-up window.
(2) Select the instances you want to display and click "Confirm" to successfully add them.
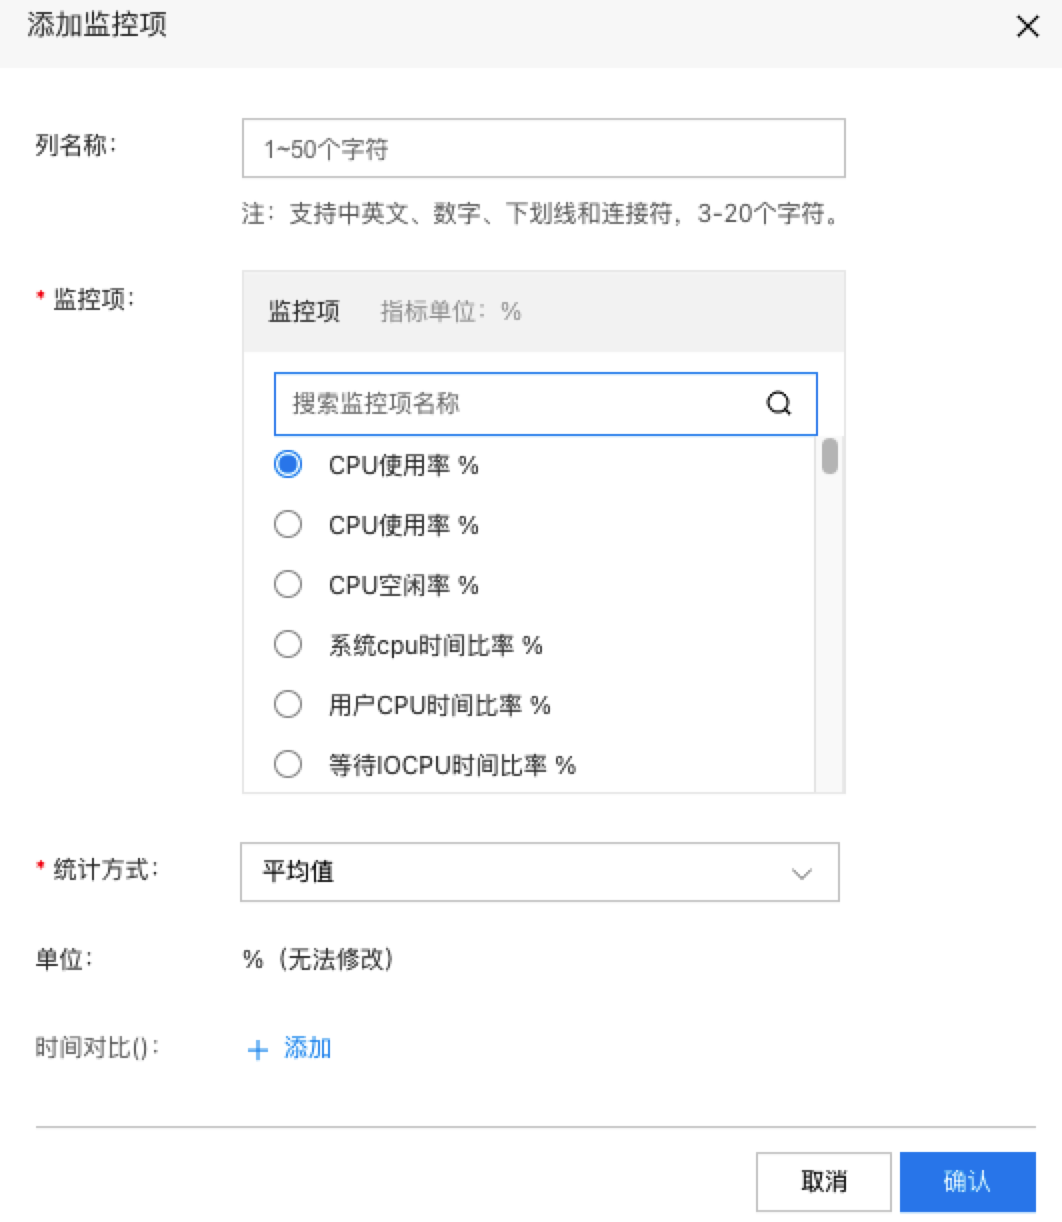
(3) Click "Add Metric," choose the metrics you want to display, and then click "Confirm" to finalize the addition.
Description:
- Column name: Displays the metric name by default but allows customization.
- Each table can only include one product and metrics with the same unit.
- Dashboard Chart
(1) Click the "Add Metric" button to open the respective pop-up window.
(2) Select the instances you want to display and click "Confirm" to successfully add them.
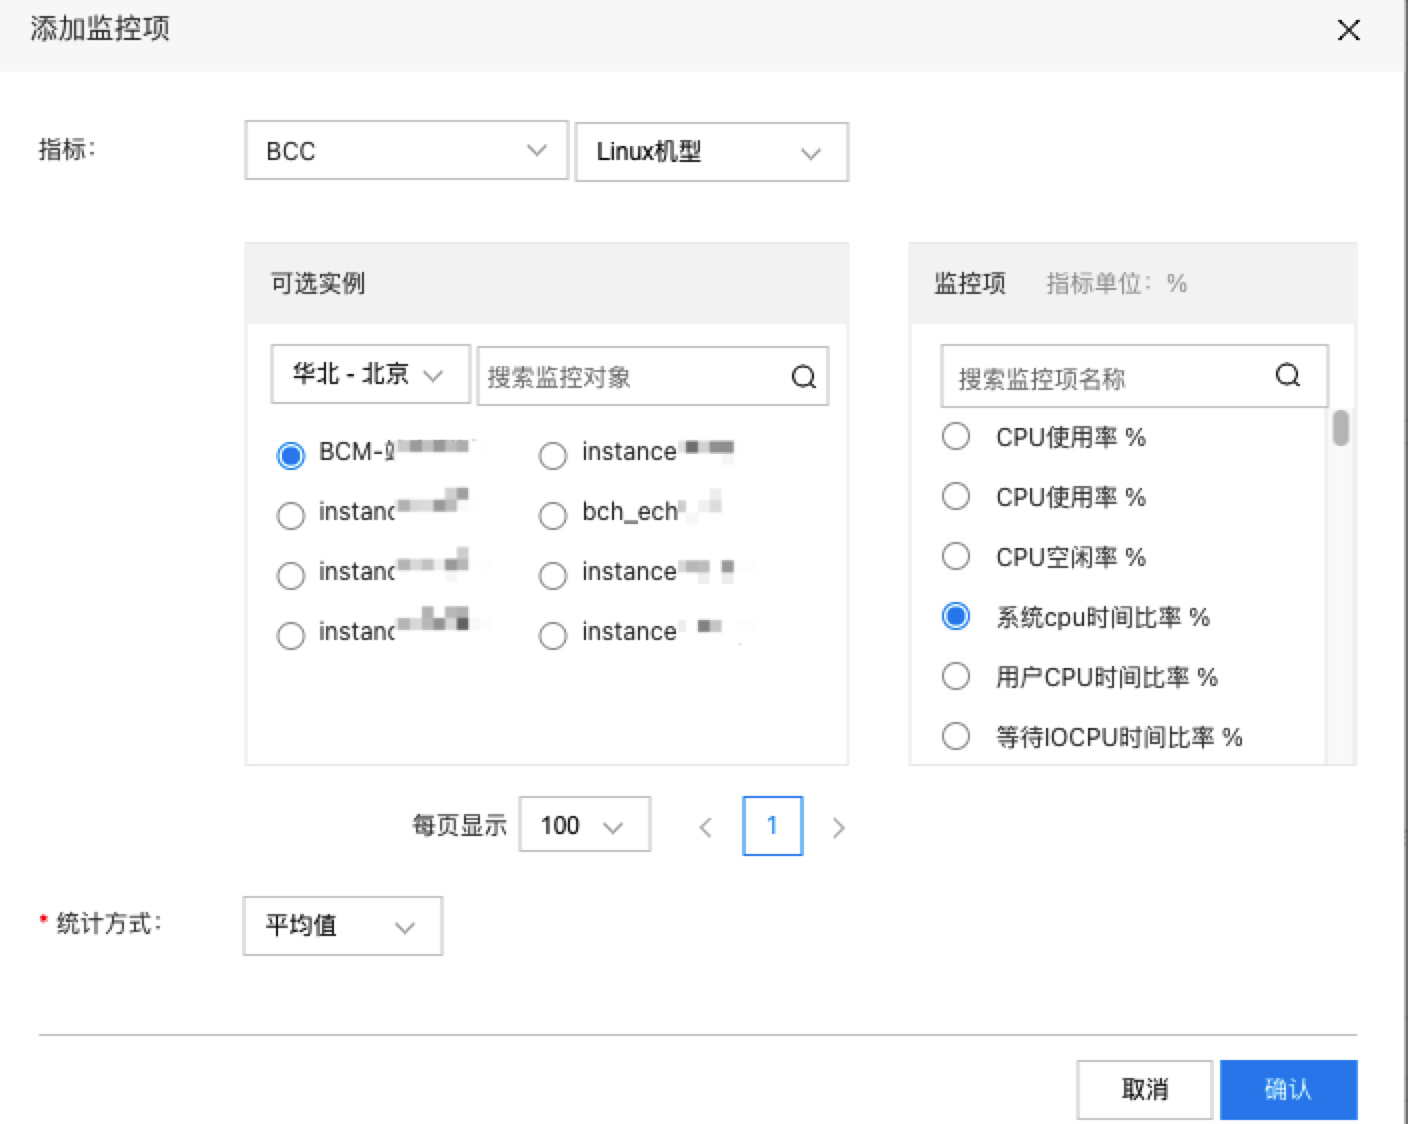
Note: A dashboard chart can only configure a single monitoring data source.
- Data panel
(1) Click the Add Metric button to open the Add Metric pop-up window.
(2) Select the instances you want to display and click "Confirm" to successfully add them.
- Click "Preview Chart," and then click "Finish" to complete the creation process.
View chart
- Select "Dashboard" from the left navigation bar to enter the Dashboard List page.
- Click the dashboard name to access its details page and view all configured charts
Set the dashboard time range
Click the time selection module at the top of the page to adjust the time range for dashboard data display.
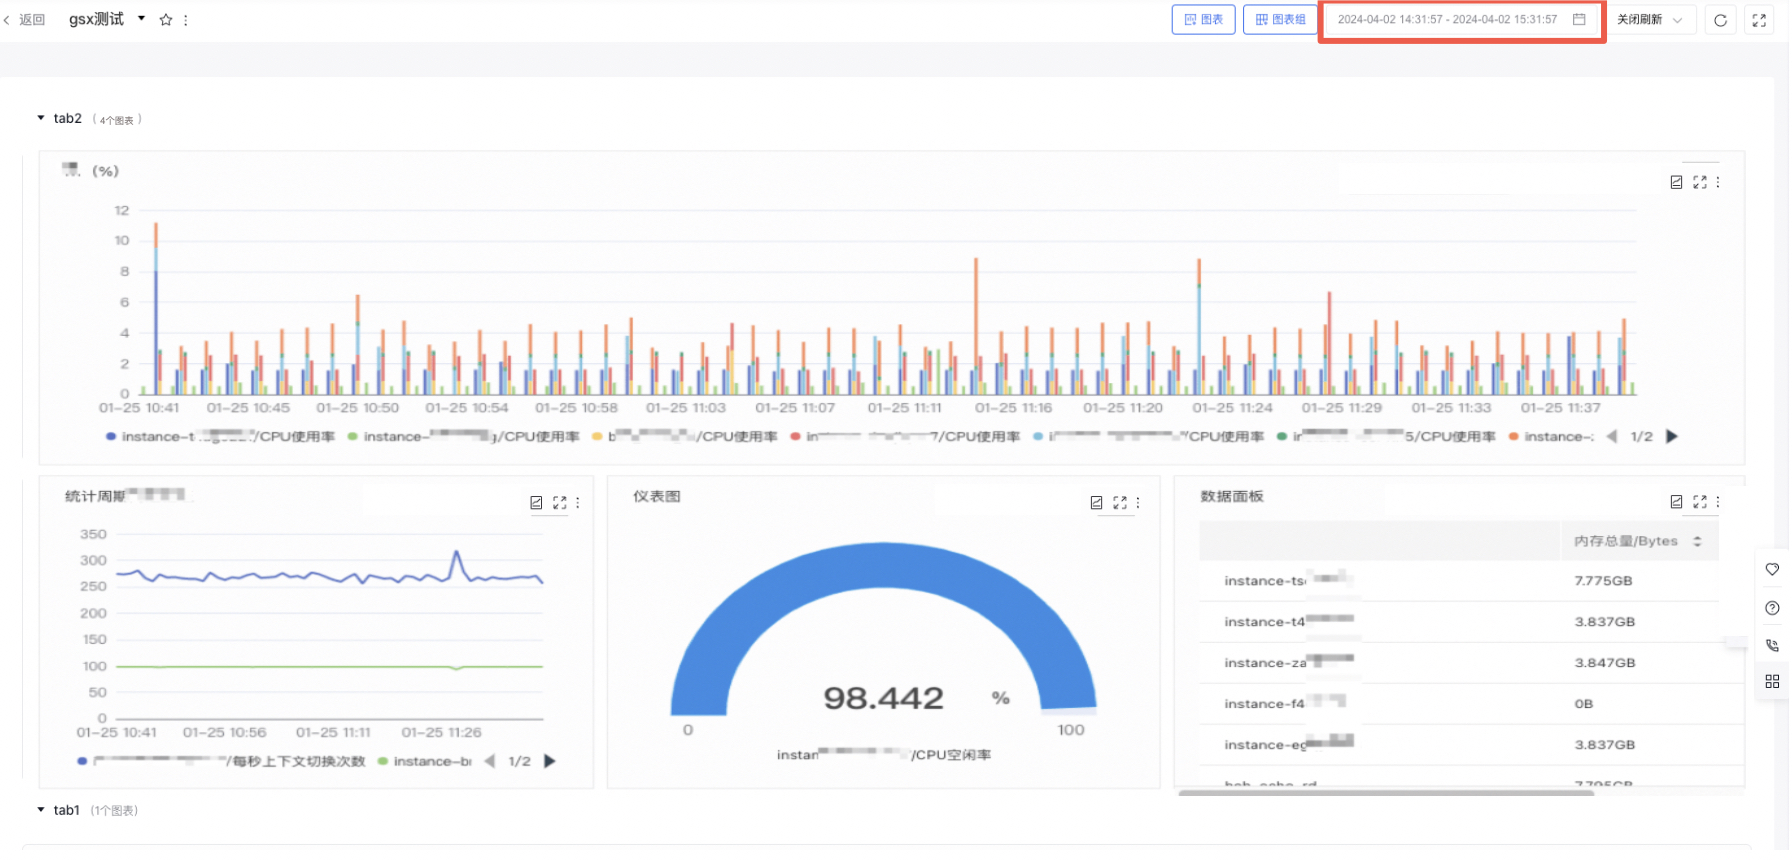
Note: This applies exclusively to charts configured with "Use Dashboard Time Range" or "Set Relative Time Range."
Enable real-time data refresh
Use the "Real-time Refresh" dropdown at the top of the page to select a time interval for refreshing chart data in real-time.
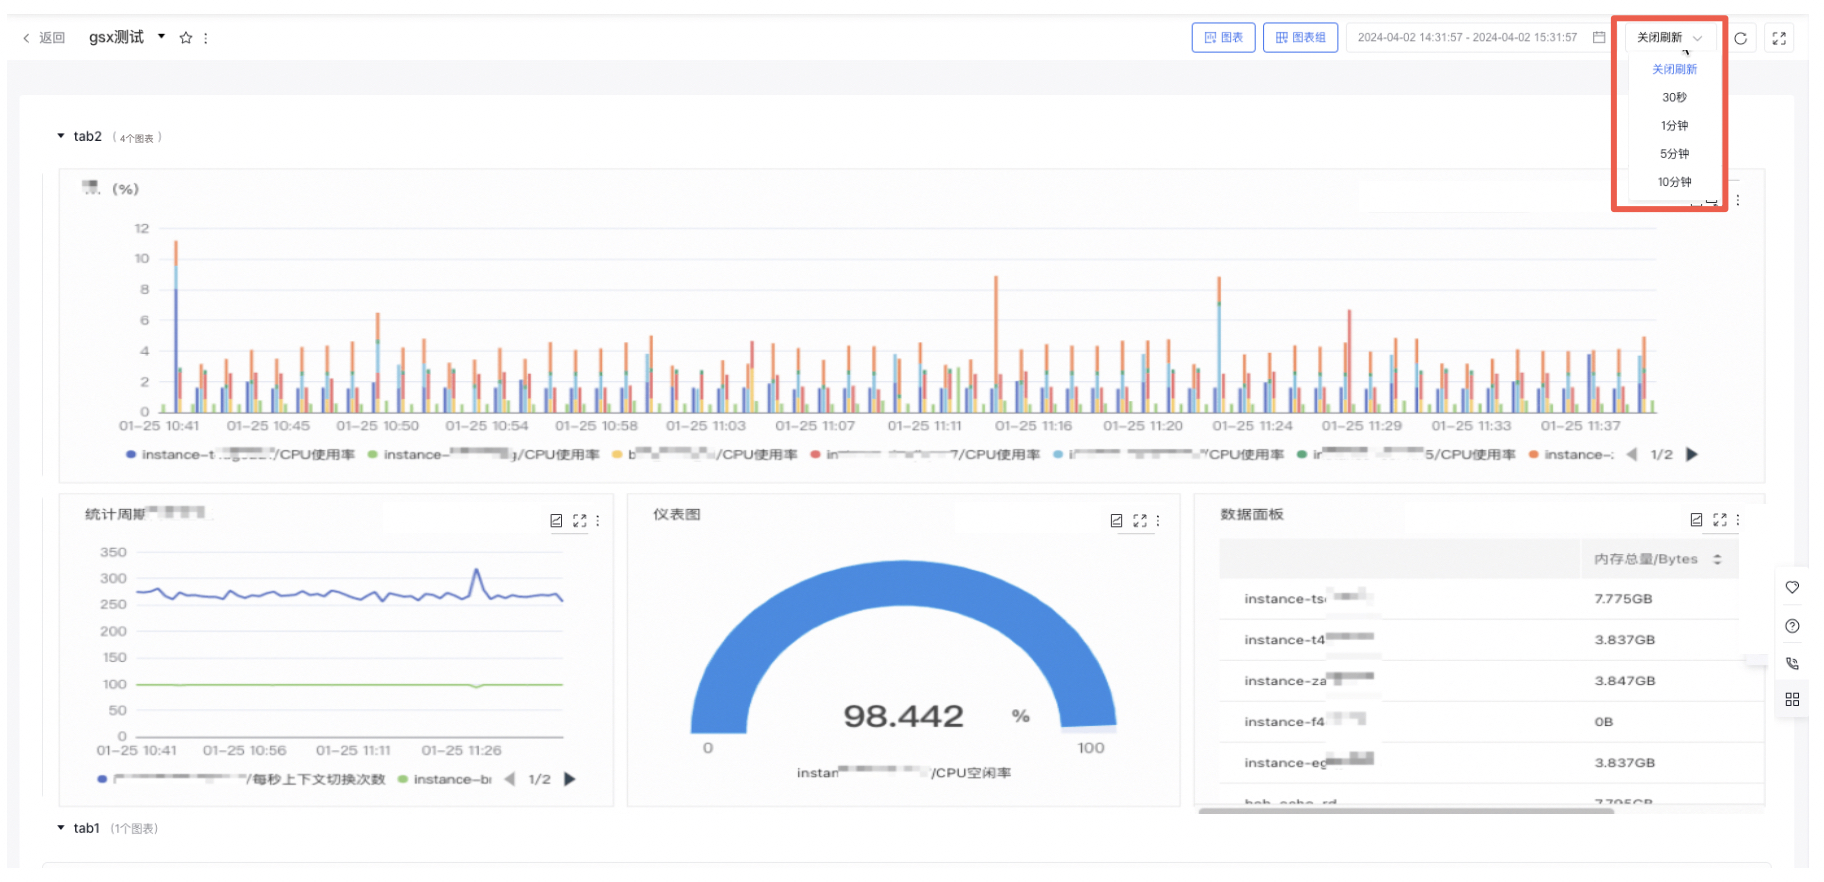
Note: This applies exclusively to charts configured with "Use Dashboard Time Range" or "Set Relative Time Range."
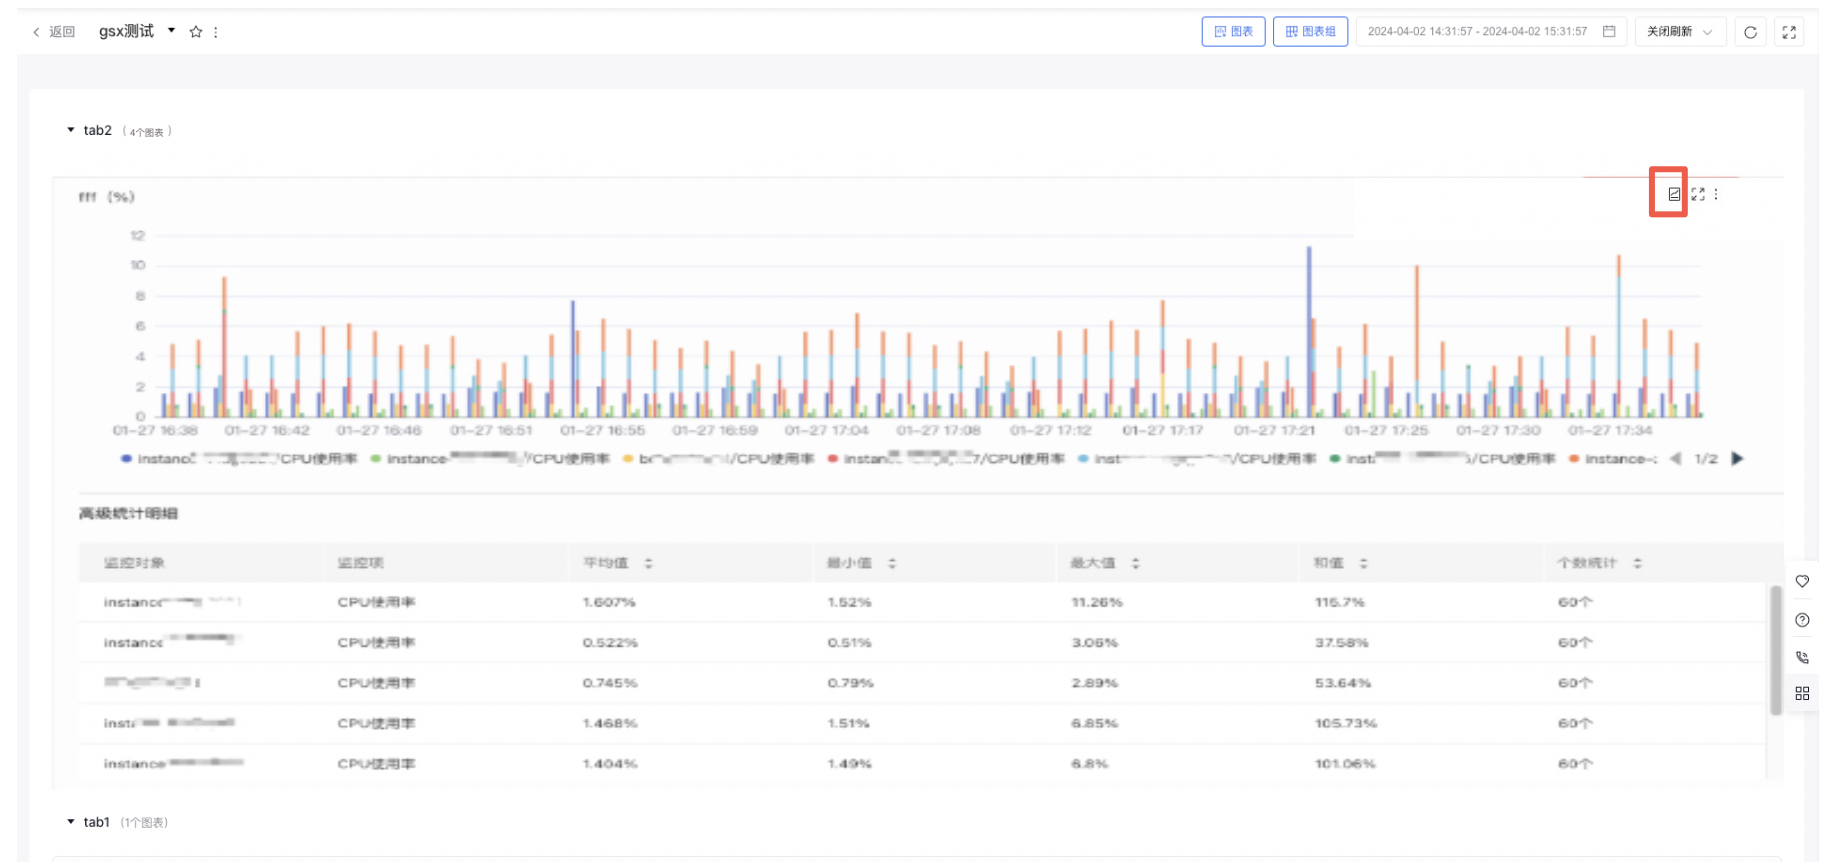
Open advanced details
Click the "Advanced Details" button to open a list showing advanced statistics like average, maximum, minimum, sum, and count for all chart data.
Edit/copy/delete chart
- Select "Dashboard" from the left navigation bar to enter the Dashboard List page.
- Click on the dashboard name to navigate to its details page.
- Click the "More" button in the chart's upper-right corner, then select "Edit" to enter the chart configuration page.
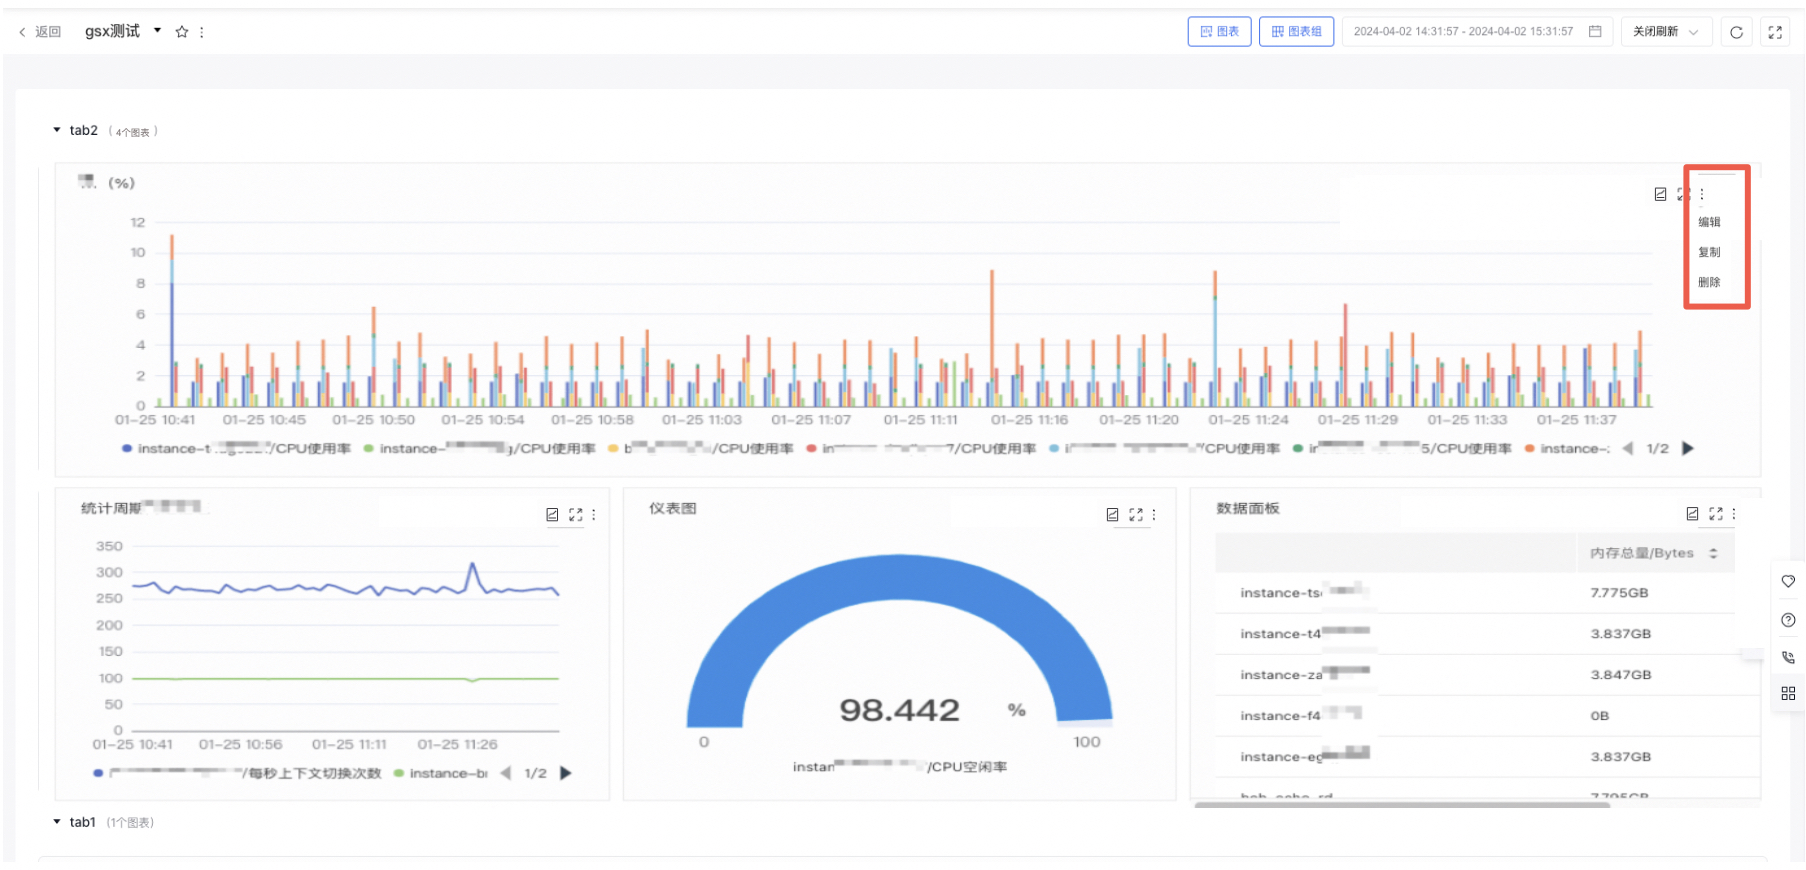
- Edit the information, click "Preview Chart," and then click "Finish" to save the changes.
- Click the "Copy/Delete" button to duplicate or remove the chart.
Move chart
- Select "Dashboard" from the left navigation bar to enter the Dashboard List page.
- Click on the dashboard name to navigate to its details page.
- Hold and drag charts to sort them either within groups or to other groups