Create Custom Monitor
Overview
Custom monitor provides monitoring capabilities for your proprietary service data. You can push time series metric data of your proprietary service to Baidu Cloud Monitor platform via API. View monitor data, add alarms, and check alarm records on Baidu Cloud Monitor platform to safeguard your proprietary service in real time.
- (Note: The historical custom event module was deactivated on July 30, 2025, and migrated to the event bus. Please navigate to the corresponding custom event set for adding or modification. Legacy custom events can still be pushed as custom events. New custom events created by the event bus will be pushed by event bus API).
The workflow for custom monitor is as follows:
- Create Scope
- Add monitor metrics
- Push data via API
- View monitor data
- Alarm management, including adding policies, viewing alarm records, etc.
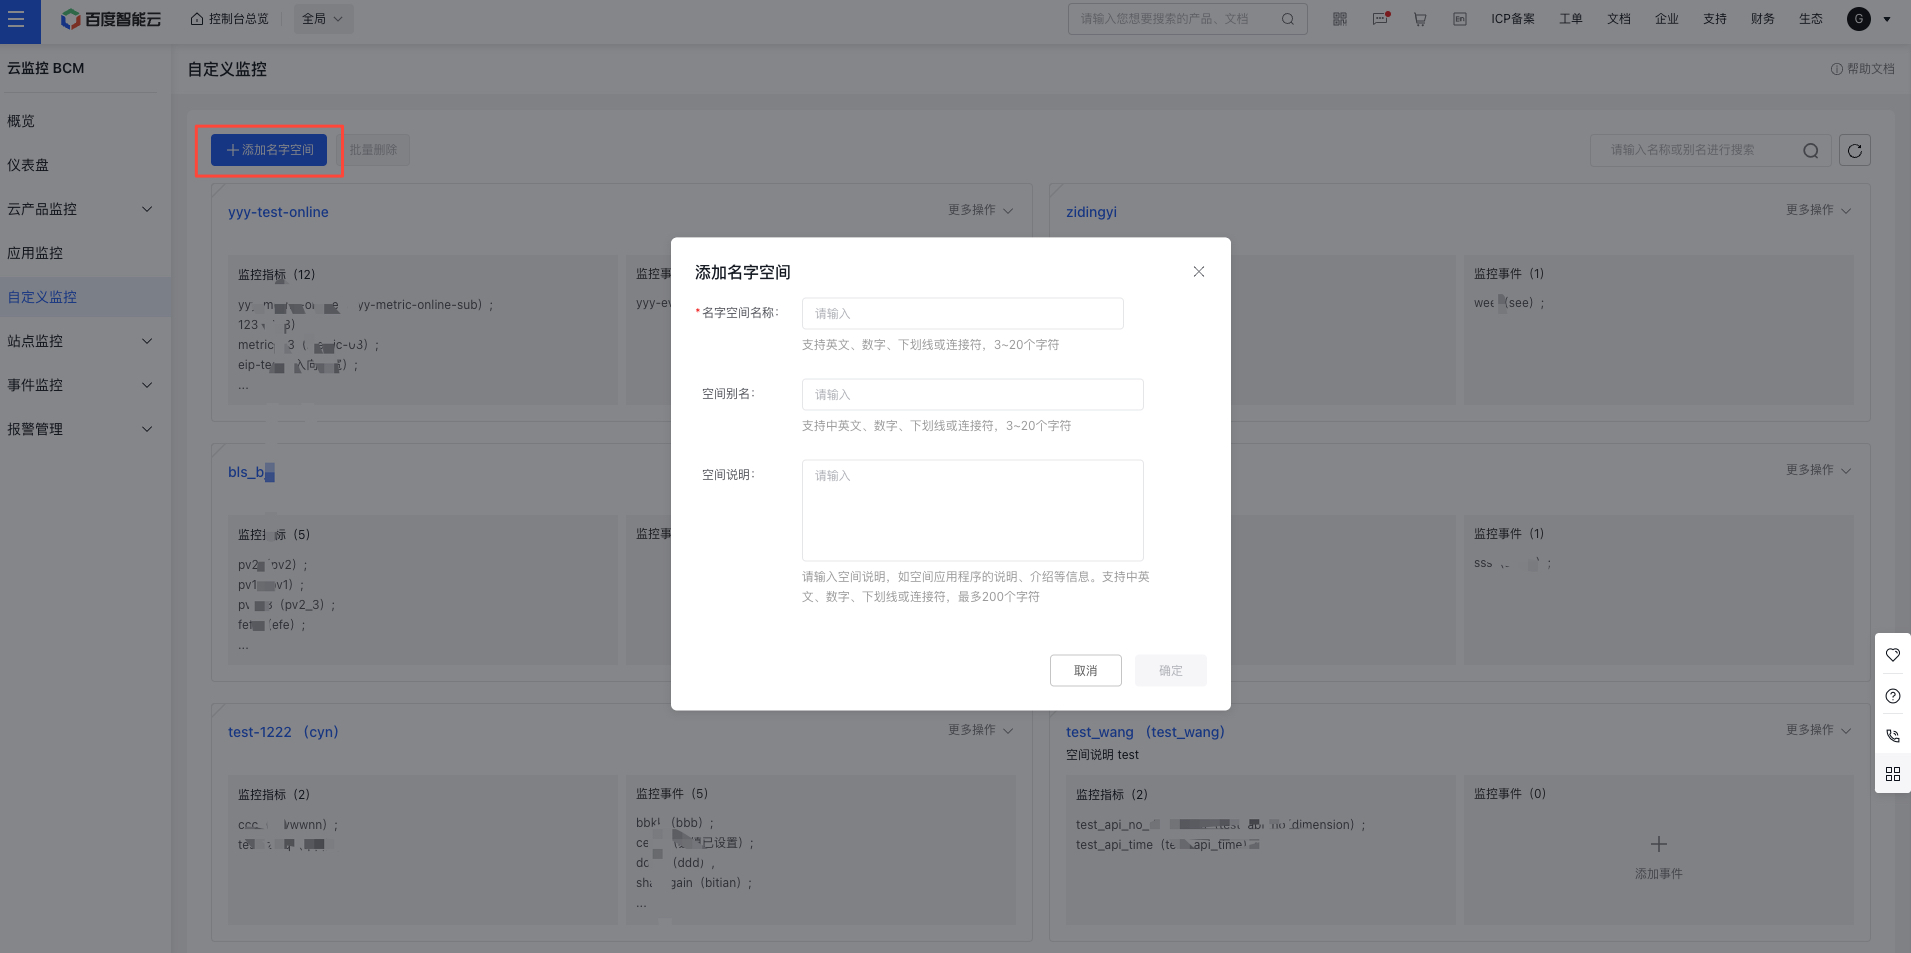
Create Scope
- Log in to the Baidu Cloud Monitor platform. Navigate to Custom Monitor - Add Scope in the left-hand menu to open the scope creation form. Fill in the required details to successfully create a scope.
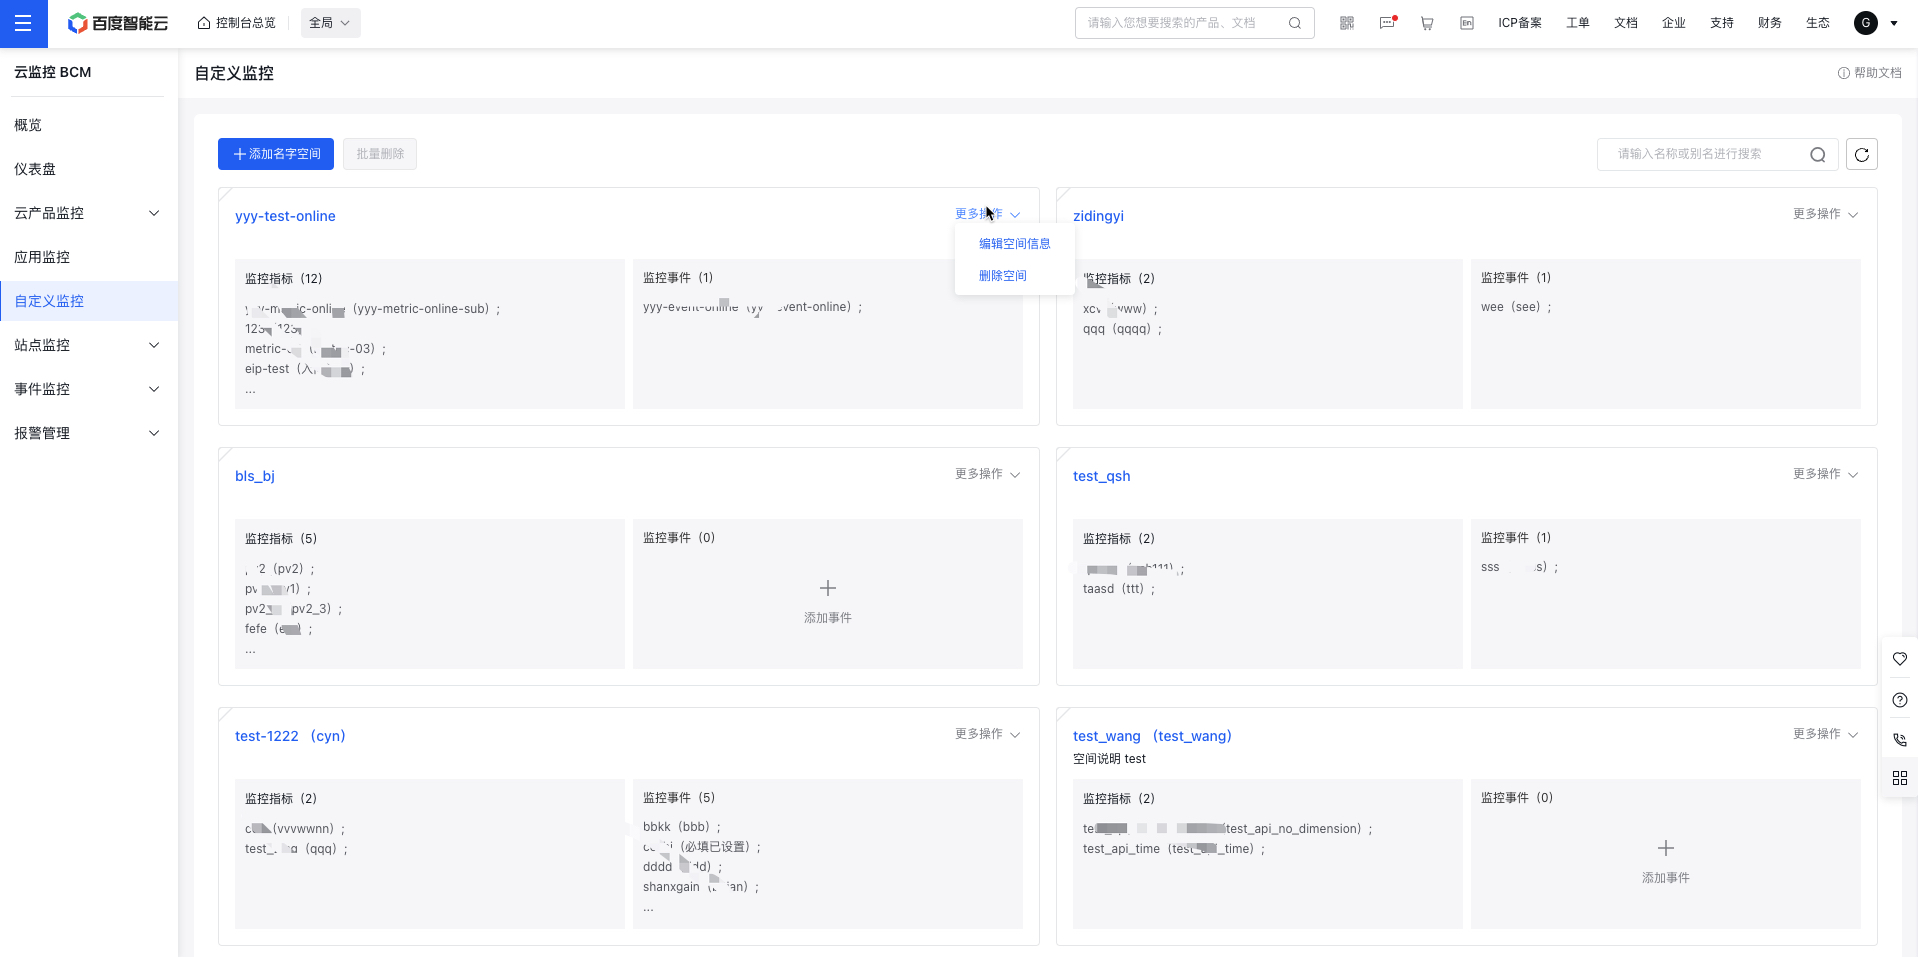
- Once the scope is created, click "More Operations" in the upper right corner to edit or delete the scope as needed.
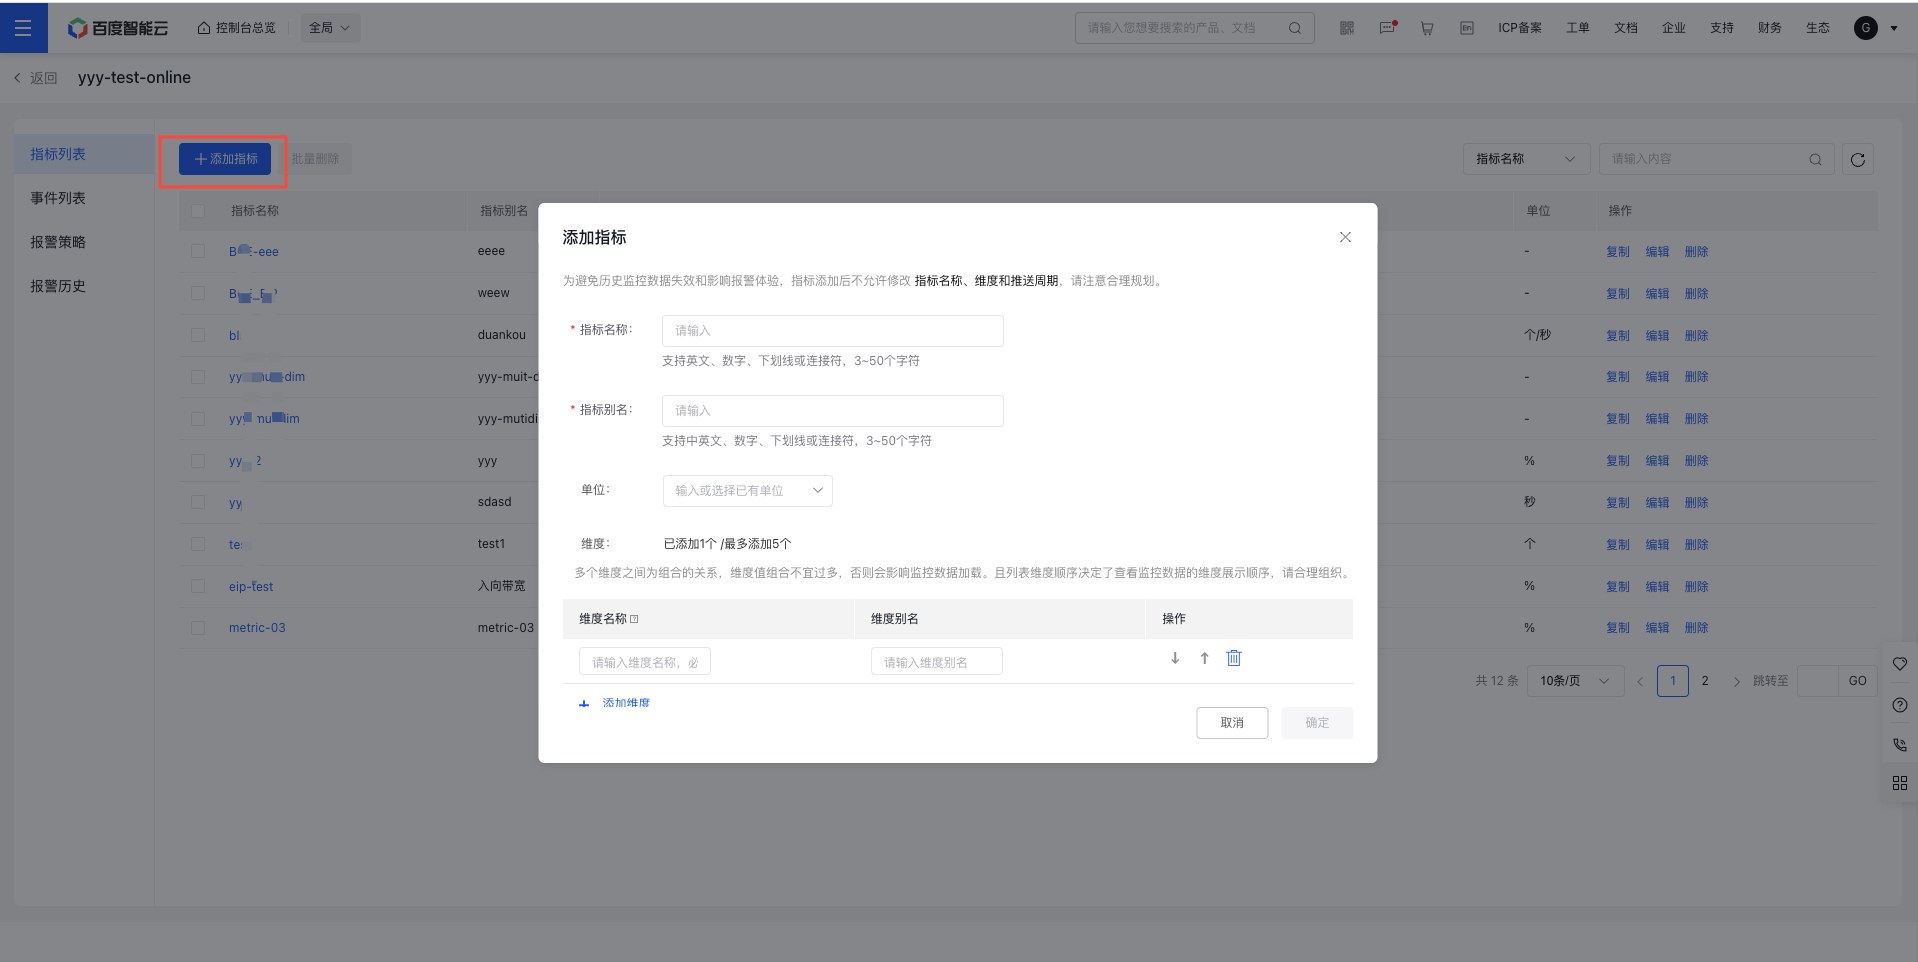
Add monitor metrics
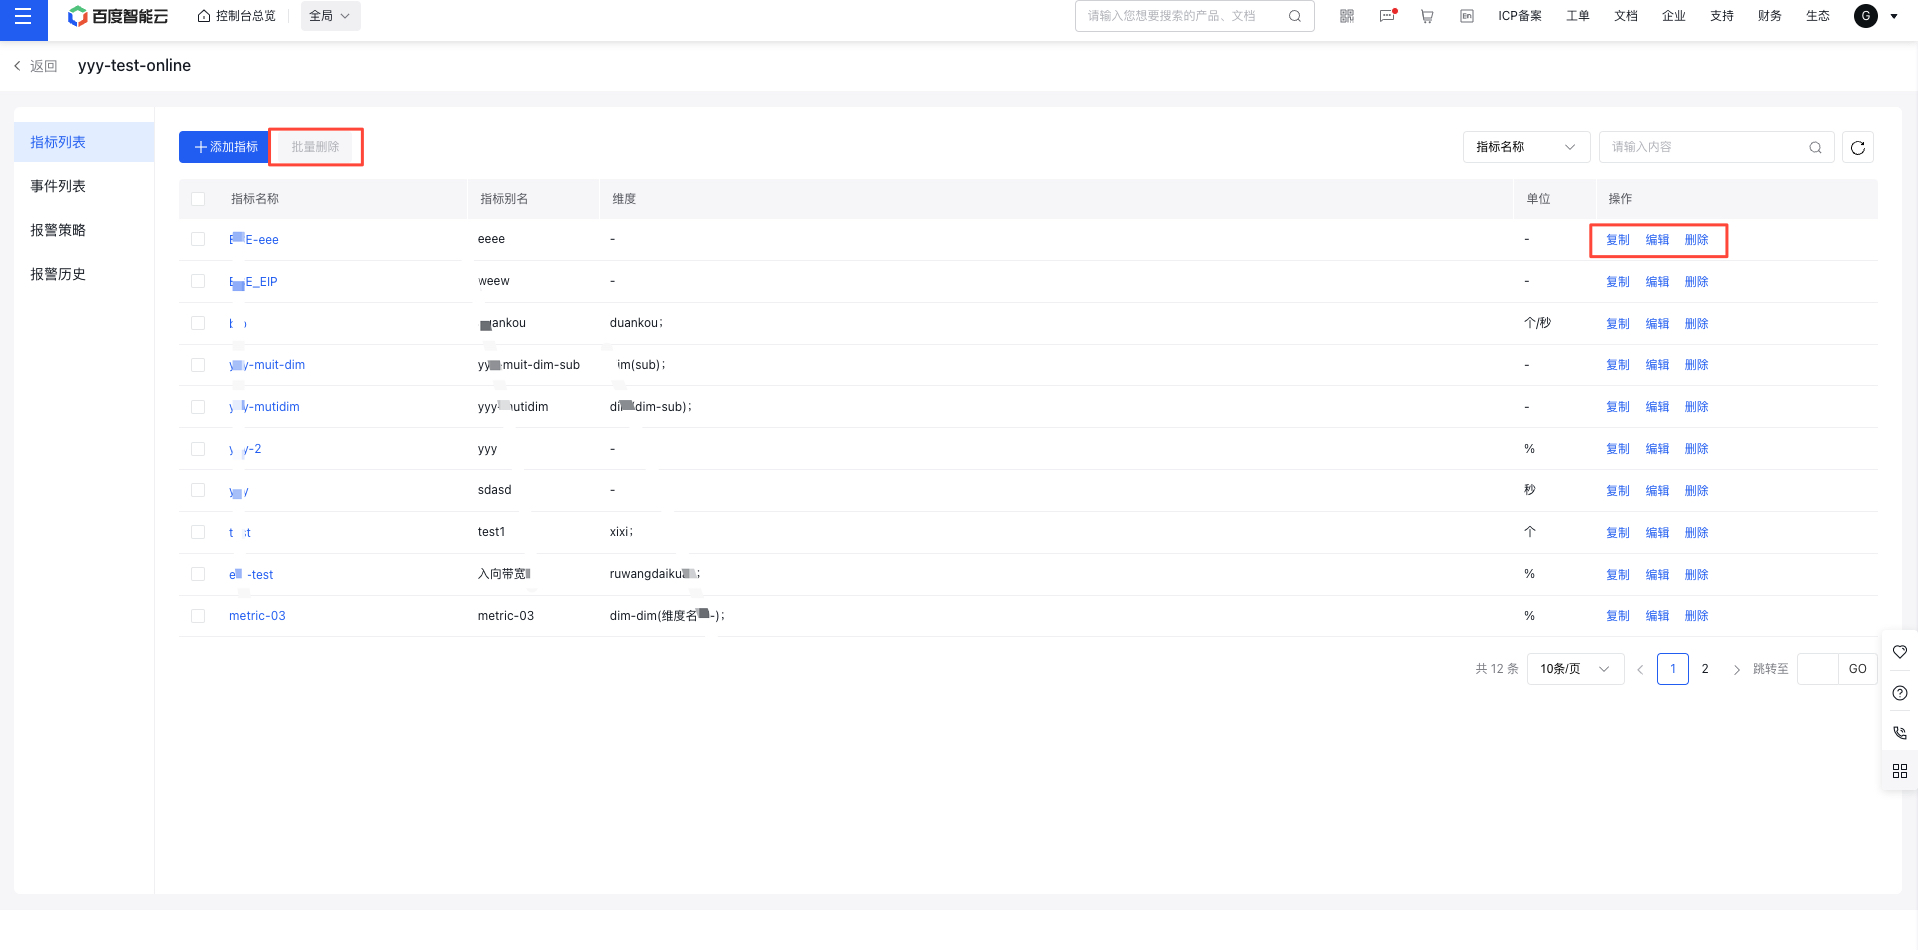
- Log in to the Baidu Cloud Monitor platform. Navigate to Custom Monitor - Scope Name in the left-hand menu to open the Metric List page for the selected scope. Click "Add Metrics," complete the form, and configure the metric information.
- After configuring the metric information, view all monitoring metrics under the scope on the Metric List page. Use the "Quick Operations" feature to edit, copy, delete, or bulk delete metrics to streamline your management tasks.
Description:
To ensure historical monitoring data remains accessible and avoids impacting alarm performance, metric names, dimensions, and push intervals cannot be modified once added. Plan these settings carefully.
Push data via API
- To push metric data, refer to the API: Push Metric Data
View monitor data
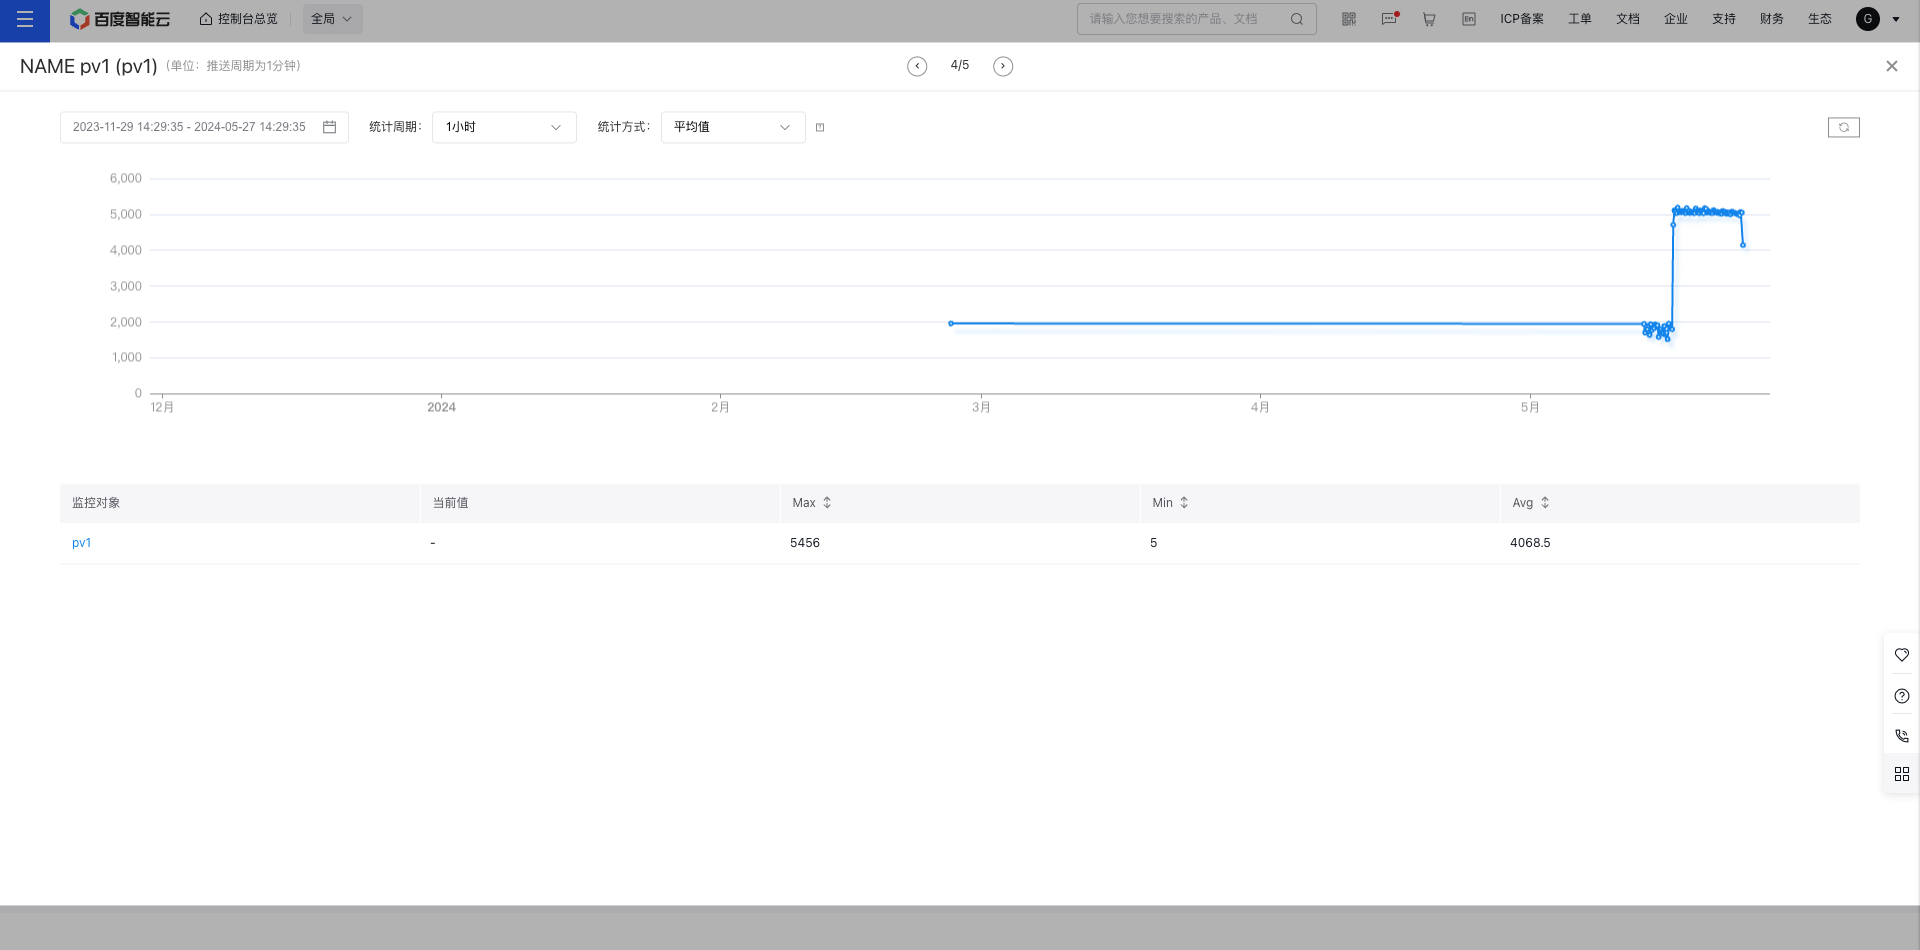
Log in to the Baidu Cloud Monitor platform. Navigate to Custom Monitor - Scope Name in the left-hand menu to access the Metric List page for the selected scope. Click a metric name to view its monitoring data. Use the left/right slide buttons at the top center to quickly switch between metrics for improved viewing efficiency.
Alarm management
Alarm strategy
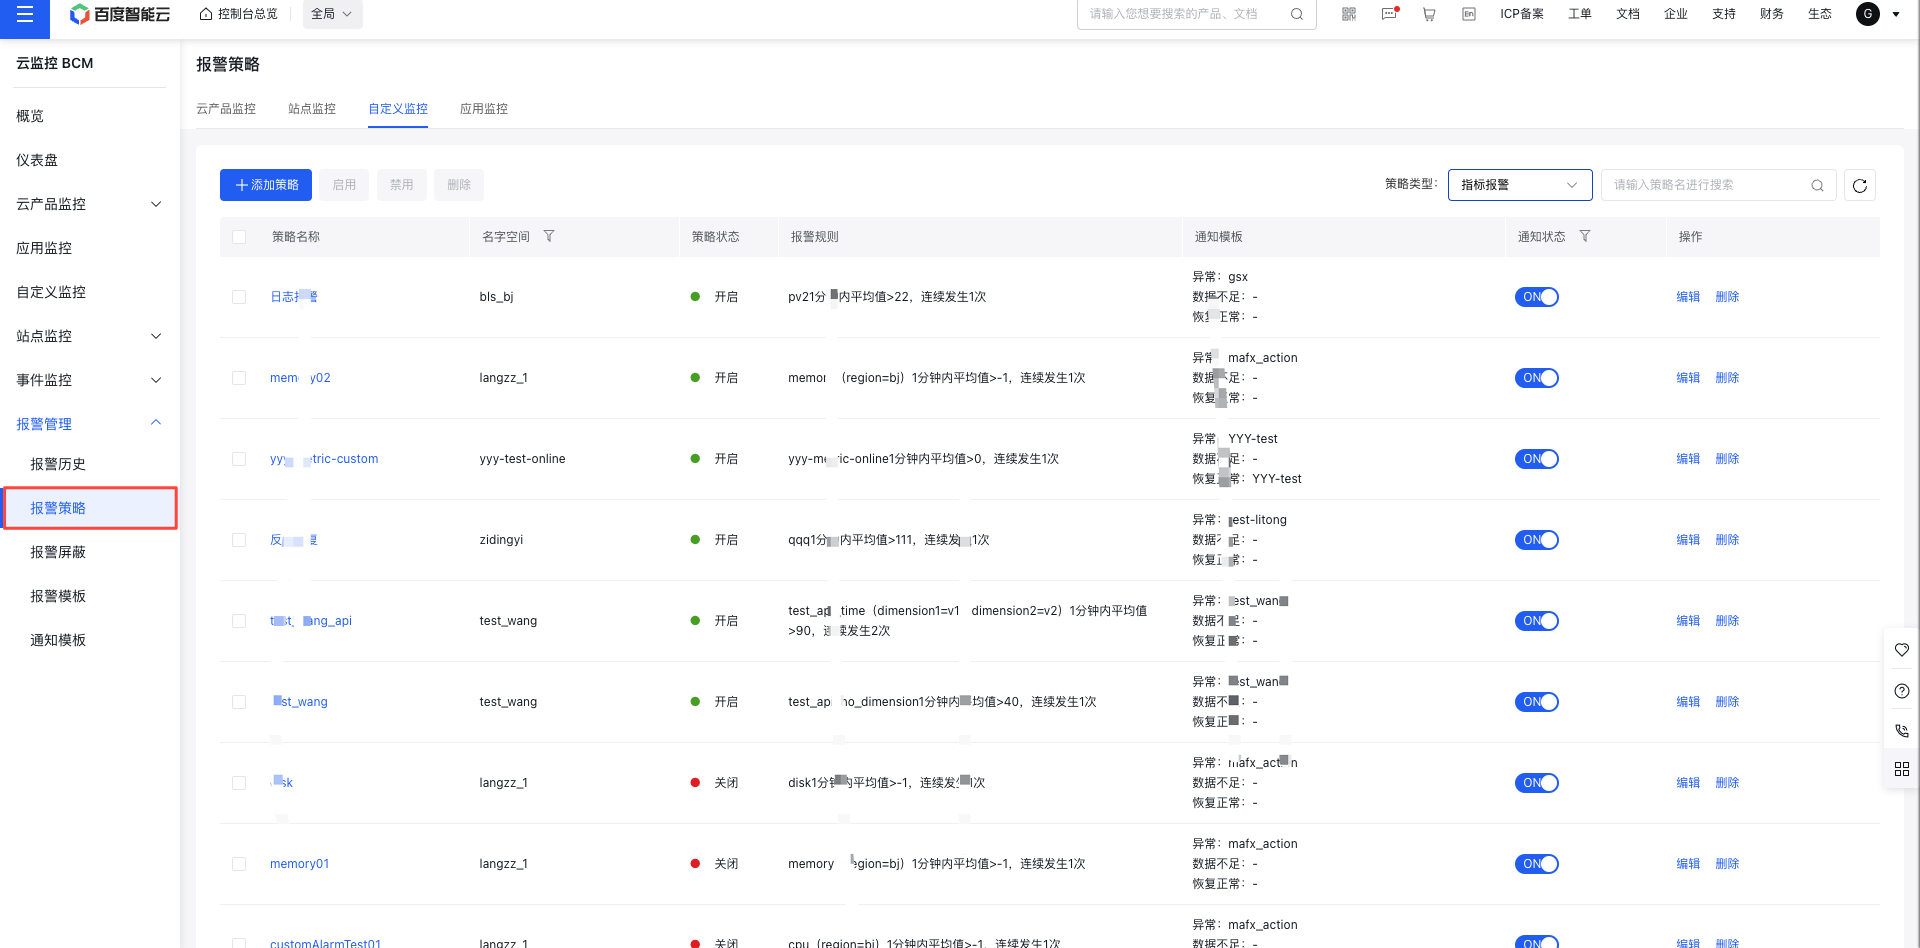
Method 1: Click "Alarm Strategy" in the secondary navigation menu of a scope to open the Alarm Strategy page. Here, you can add, view, edit, or delete alarm strategies for monitoring metrics and events within the scope, making it easier to manage alarms for specific service dimensions.
Method 2: Click "Alarm Strategy" at the global Alarm Management portal to open the global Alarm Strategy page. Manage alarm strategies across all dimensions at a global level.
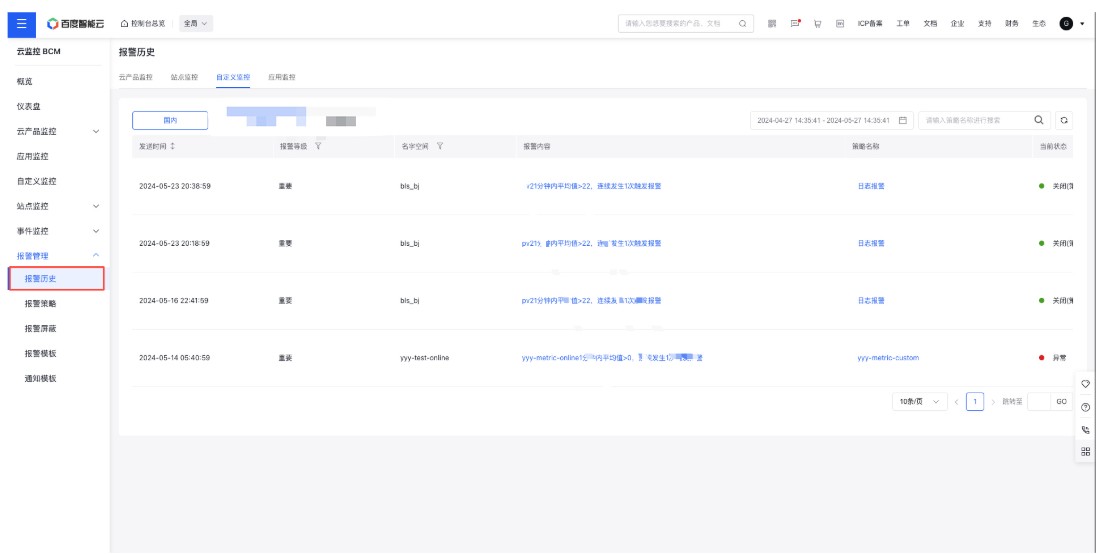
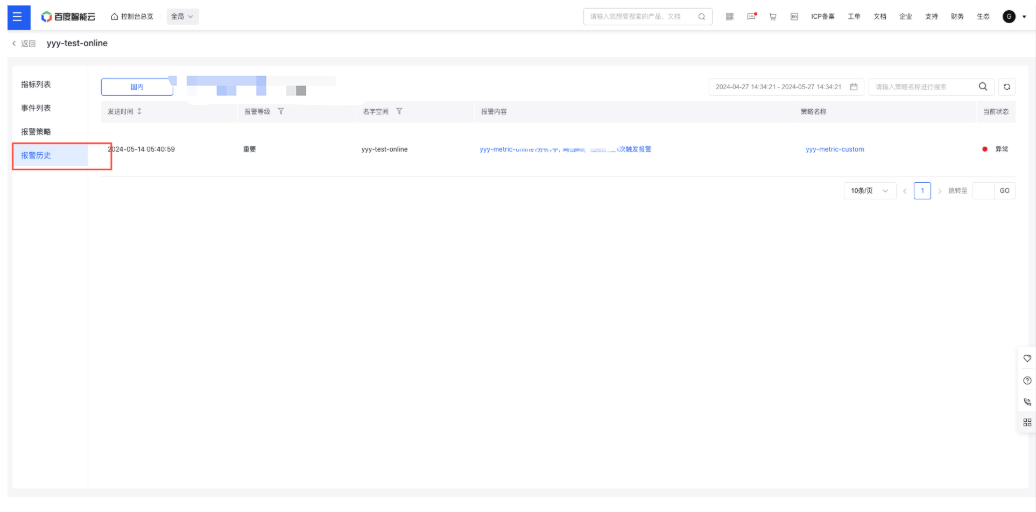
Alarm history
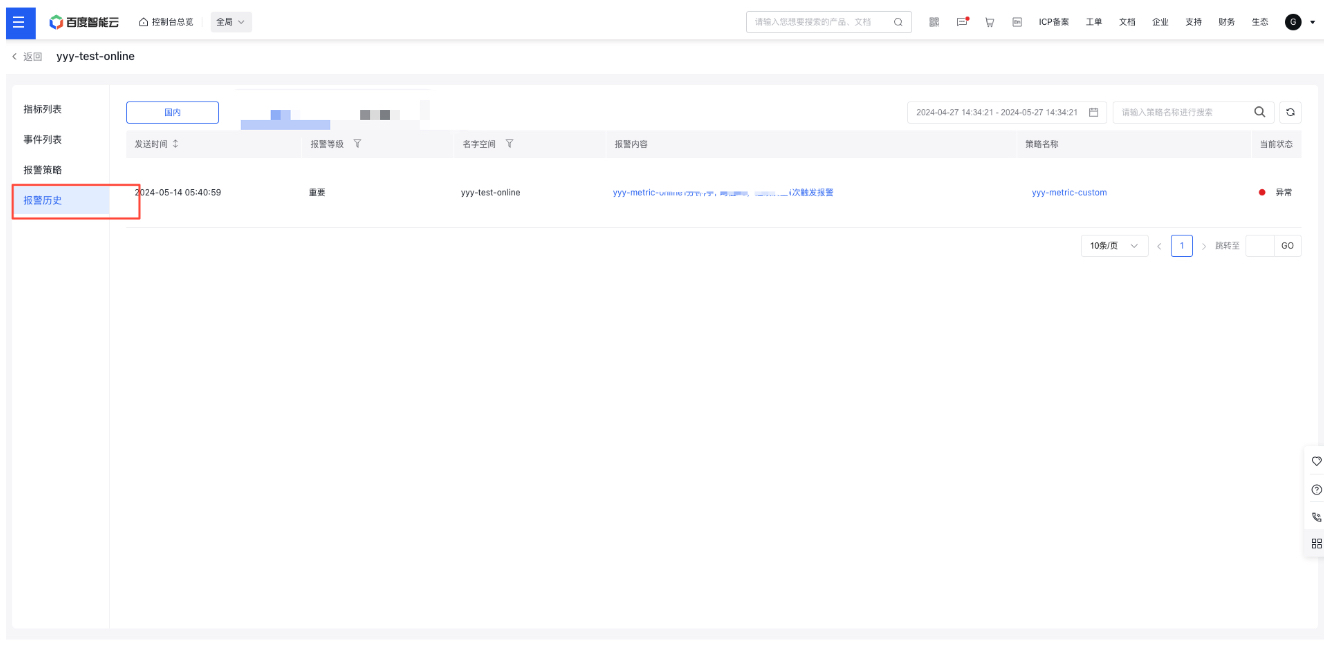
Method 1: Click "Alarm History" in the secondary navigation menu of a scope to open the Alarm History page. From here, you can review and analyze the alarm history specific to the scope.
Method 2: Access the global Alarm History page by clicking "Alarm History" within the global Alarm Management portal. This allows you to review and manage alarm histories on a global scale.