
View Metrics
Last Updated:2025-11-14
View Metrics
The View Metrics feature allows for the rapid comparison of monitoring data across multiple monitor objects and metrics within an application. It enables users to display data from different objects of a specific monitor type in a single trend chart or aggregate data from various metrics on one page. This facilitates swift examination and comparison of monitor data, aiding in exception analysis and root cause identification.
Add View Metrics
- On the Application Monitor page, click the application's name to open the corresponding Details page.
- Click on the View Metrics tab in the left navigation bar to navigate to the View Metrics page.
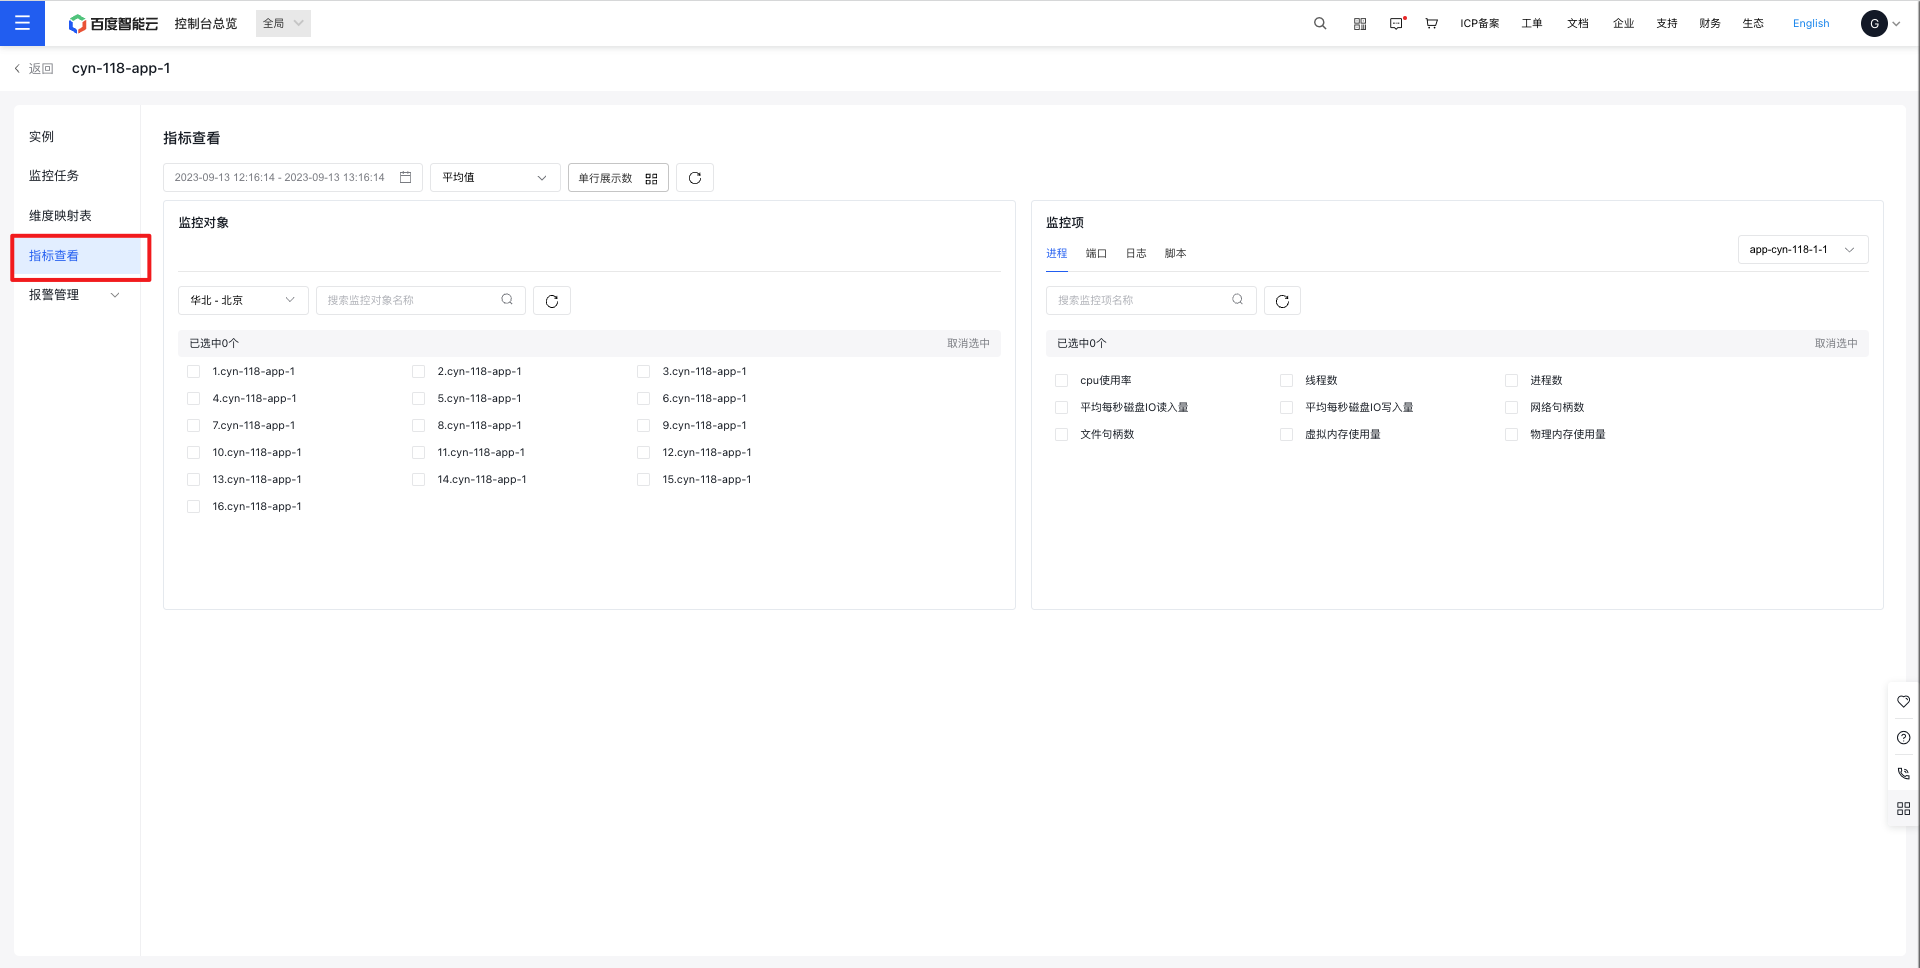
- Select the monitor object and metrics you need. Check the relevant boxes to display the monitor charts. You can also switch between different monitoring tasks and types for viewing.
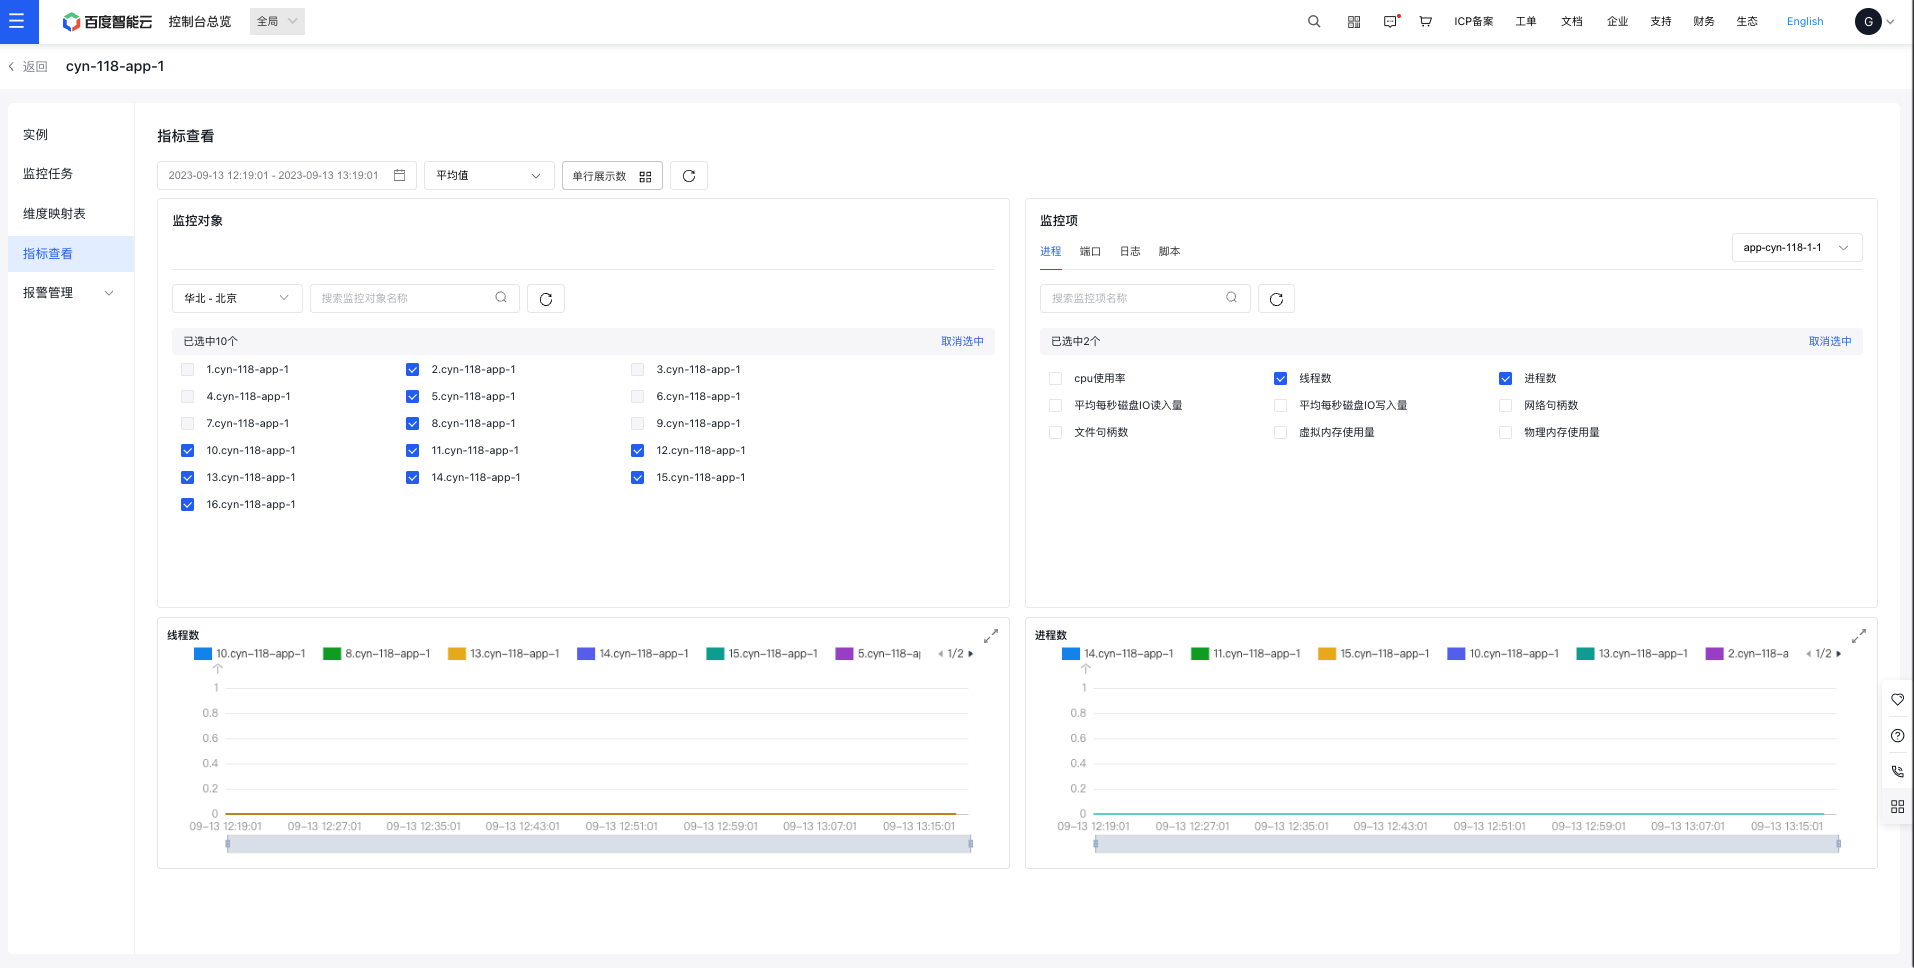
View Metrics Configuration
- Metrics: Choose between various monitoring view methods, including four options: Process (default), port, log, and script.
- Statistic methods: Supports calculation of average, sum, maximum, and minimum values.