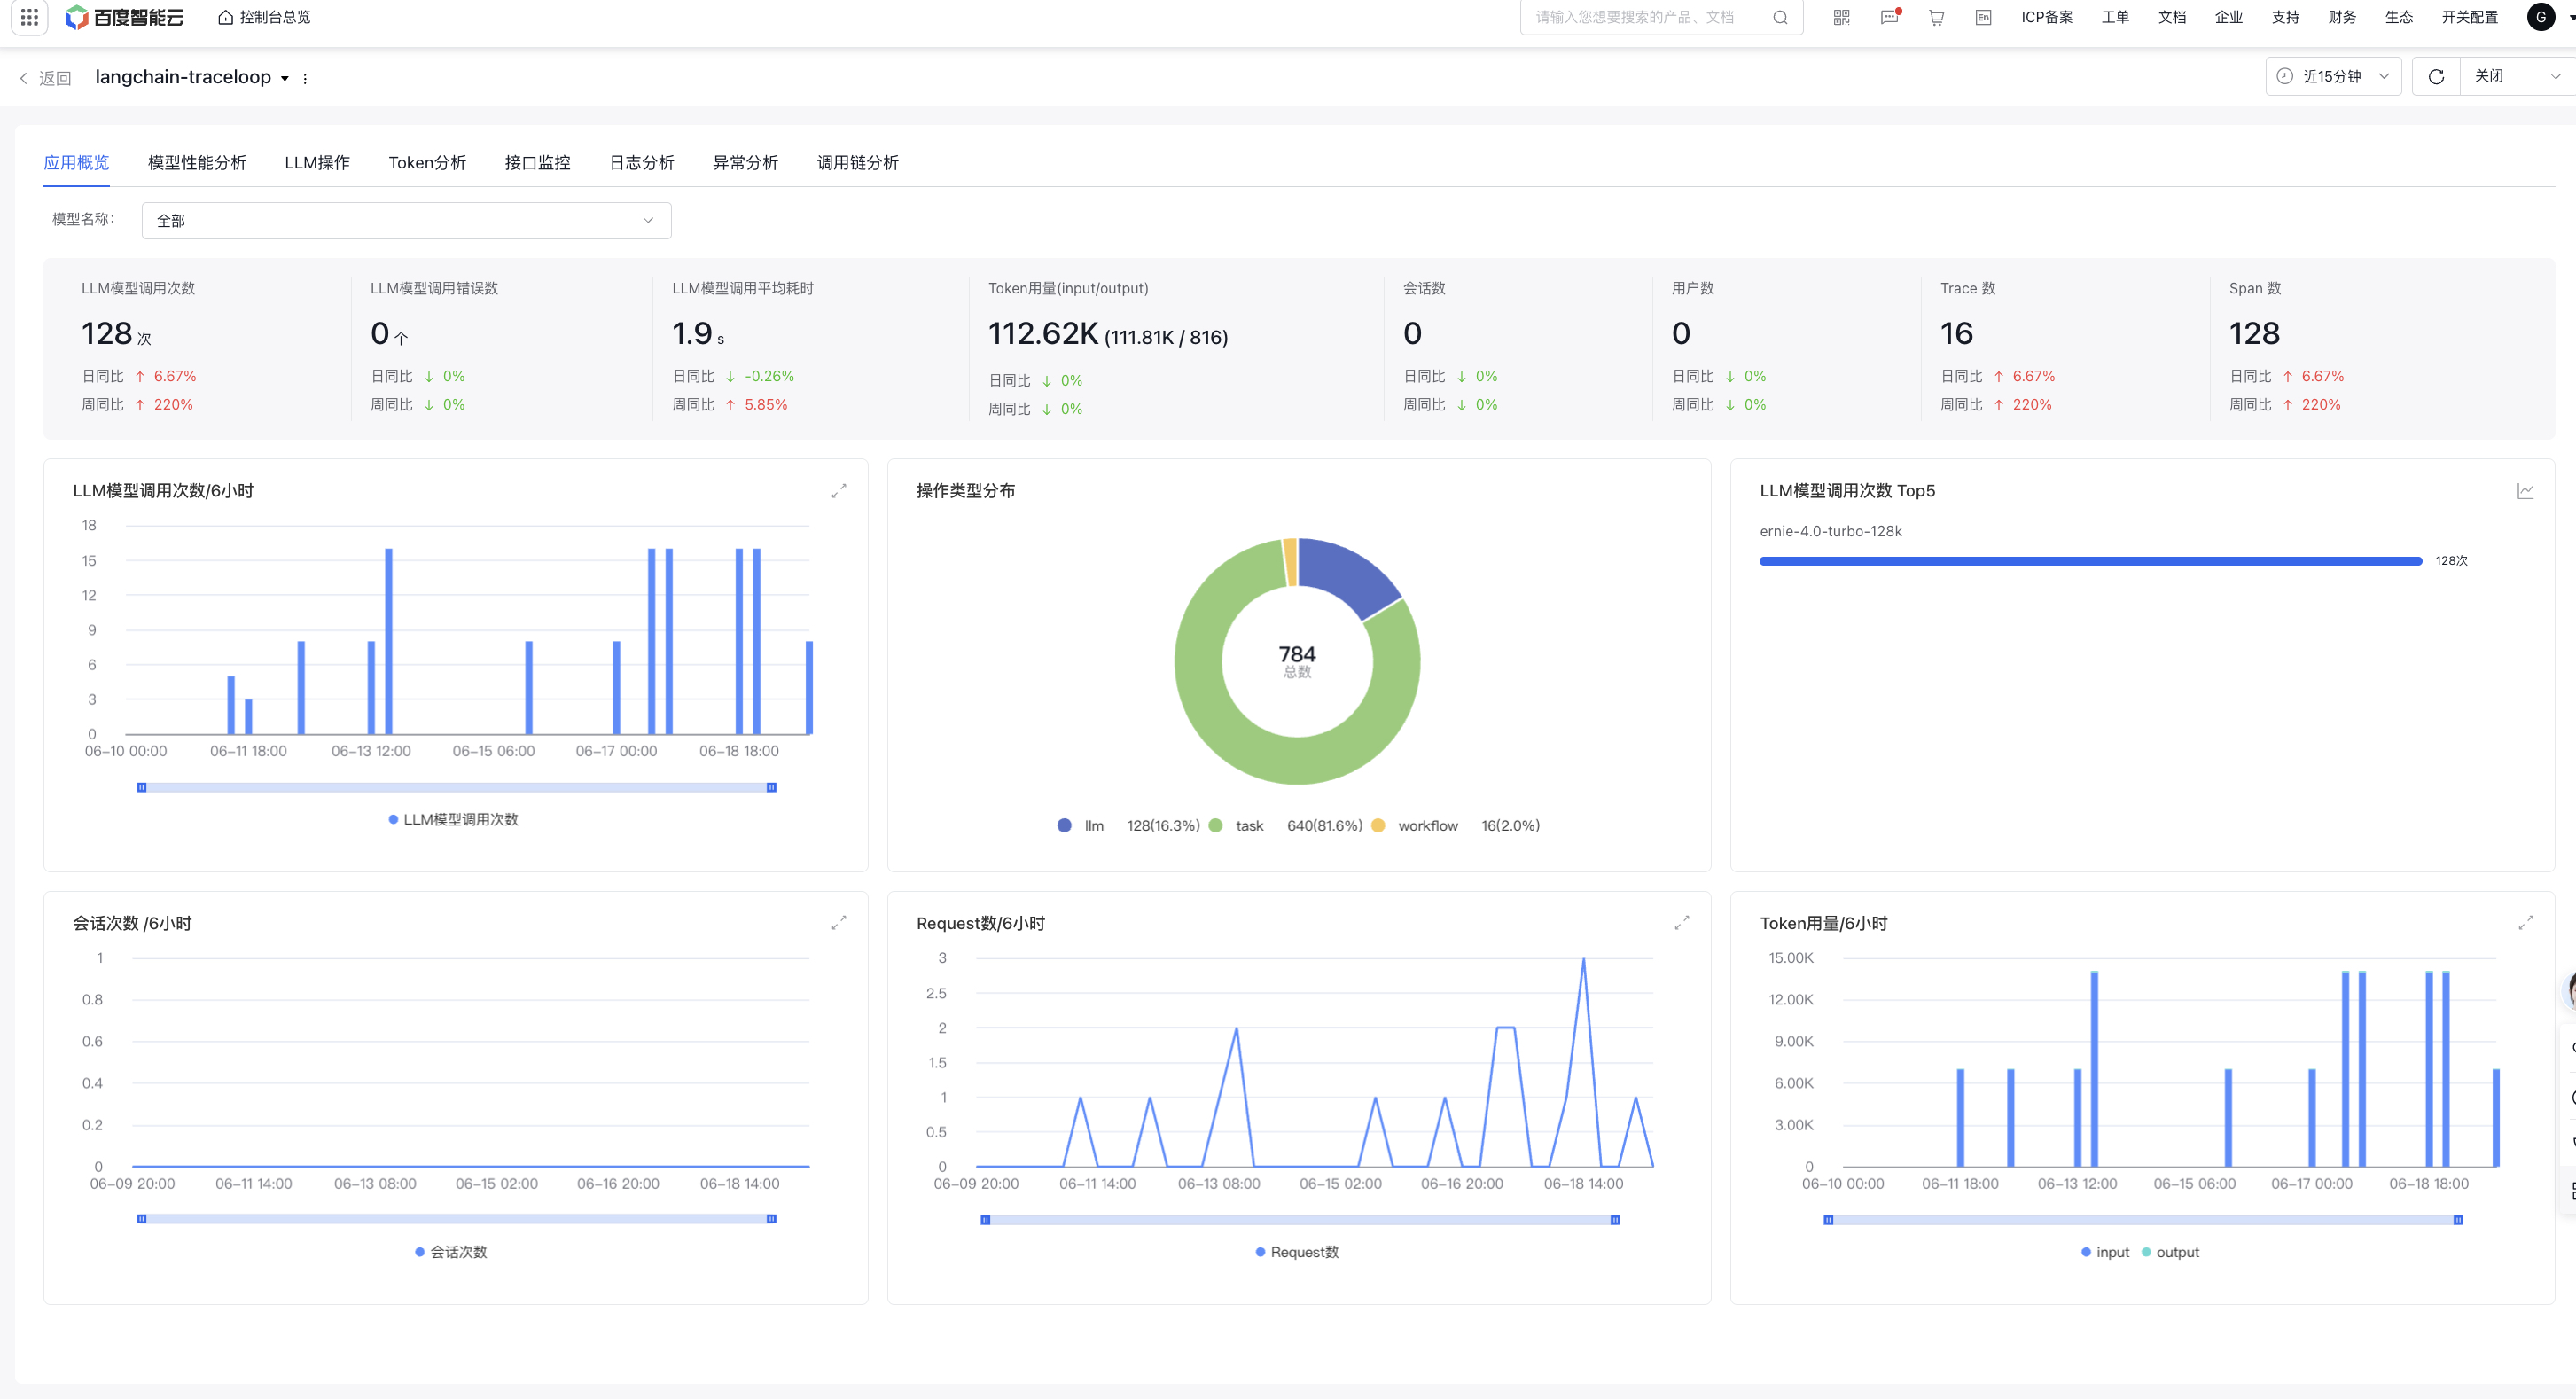
The application overview page displays core data for a single application, including model call, token usage, session count, and user count
Filter criteria: Support model filtering. By default, all application dimension data is displayed; selecting a single model shows model-specific data.
Overview data:
Panel
Description
LLM call count
Display the call count of large model generated by applications during the specified time period
LLM call error count
Display the call error count of large model generated by applications during the specified time period
Average LLM call latency
Display the average large model call latency generated by applications during the specified time period
Token usage
Display the token usage generated by applications during the specified time period
Session count
Display the count of sessions accessing the LLM application by applications during the specified time period
User count
Display the count of users using the large model application during the specified time period
Trace count
Display the count of call chains generated by applications during the specified time period
Span count
Display the count of spans generated by applications during the specified time period
LLM model-related data aggregation:
Panel
Description
Trend Chart of LLM Call Count
Display the trend chart of LLM call count
LLM model call operation type distribution chart
Display the distribution count and proportion of different operation types, including seven types: Embedding, Agent, LLM, Task, Took, Workflow, and Rerank
Top 5 LLM model call counts
Display Top 5 models by LLM call counts, supporting switching to trend chart
Other data aggregation:
Panel
Description
Session Count Trend Chart
Display the trend chart of session counts for applications accessing the LLM application
User Count Trend Chart
Display the trend chart of user counts for applications using the large model application
Trace Count Trend Chart
Display the trend chart of trace count generated by applications
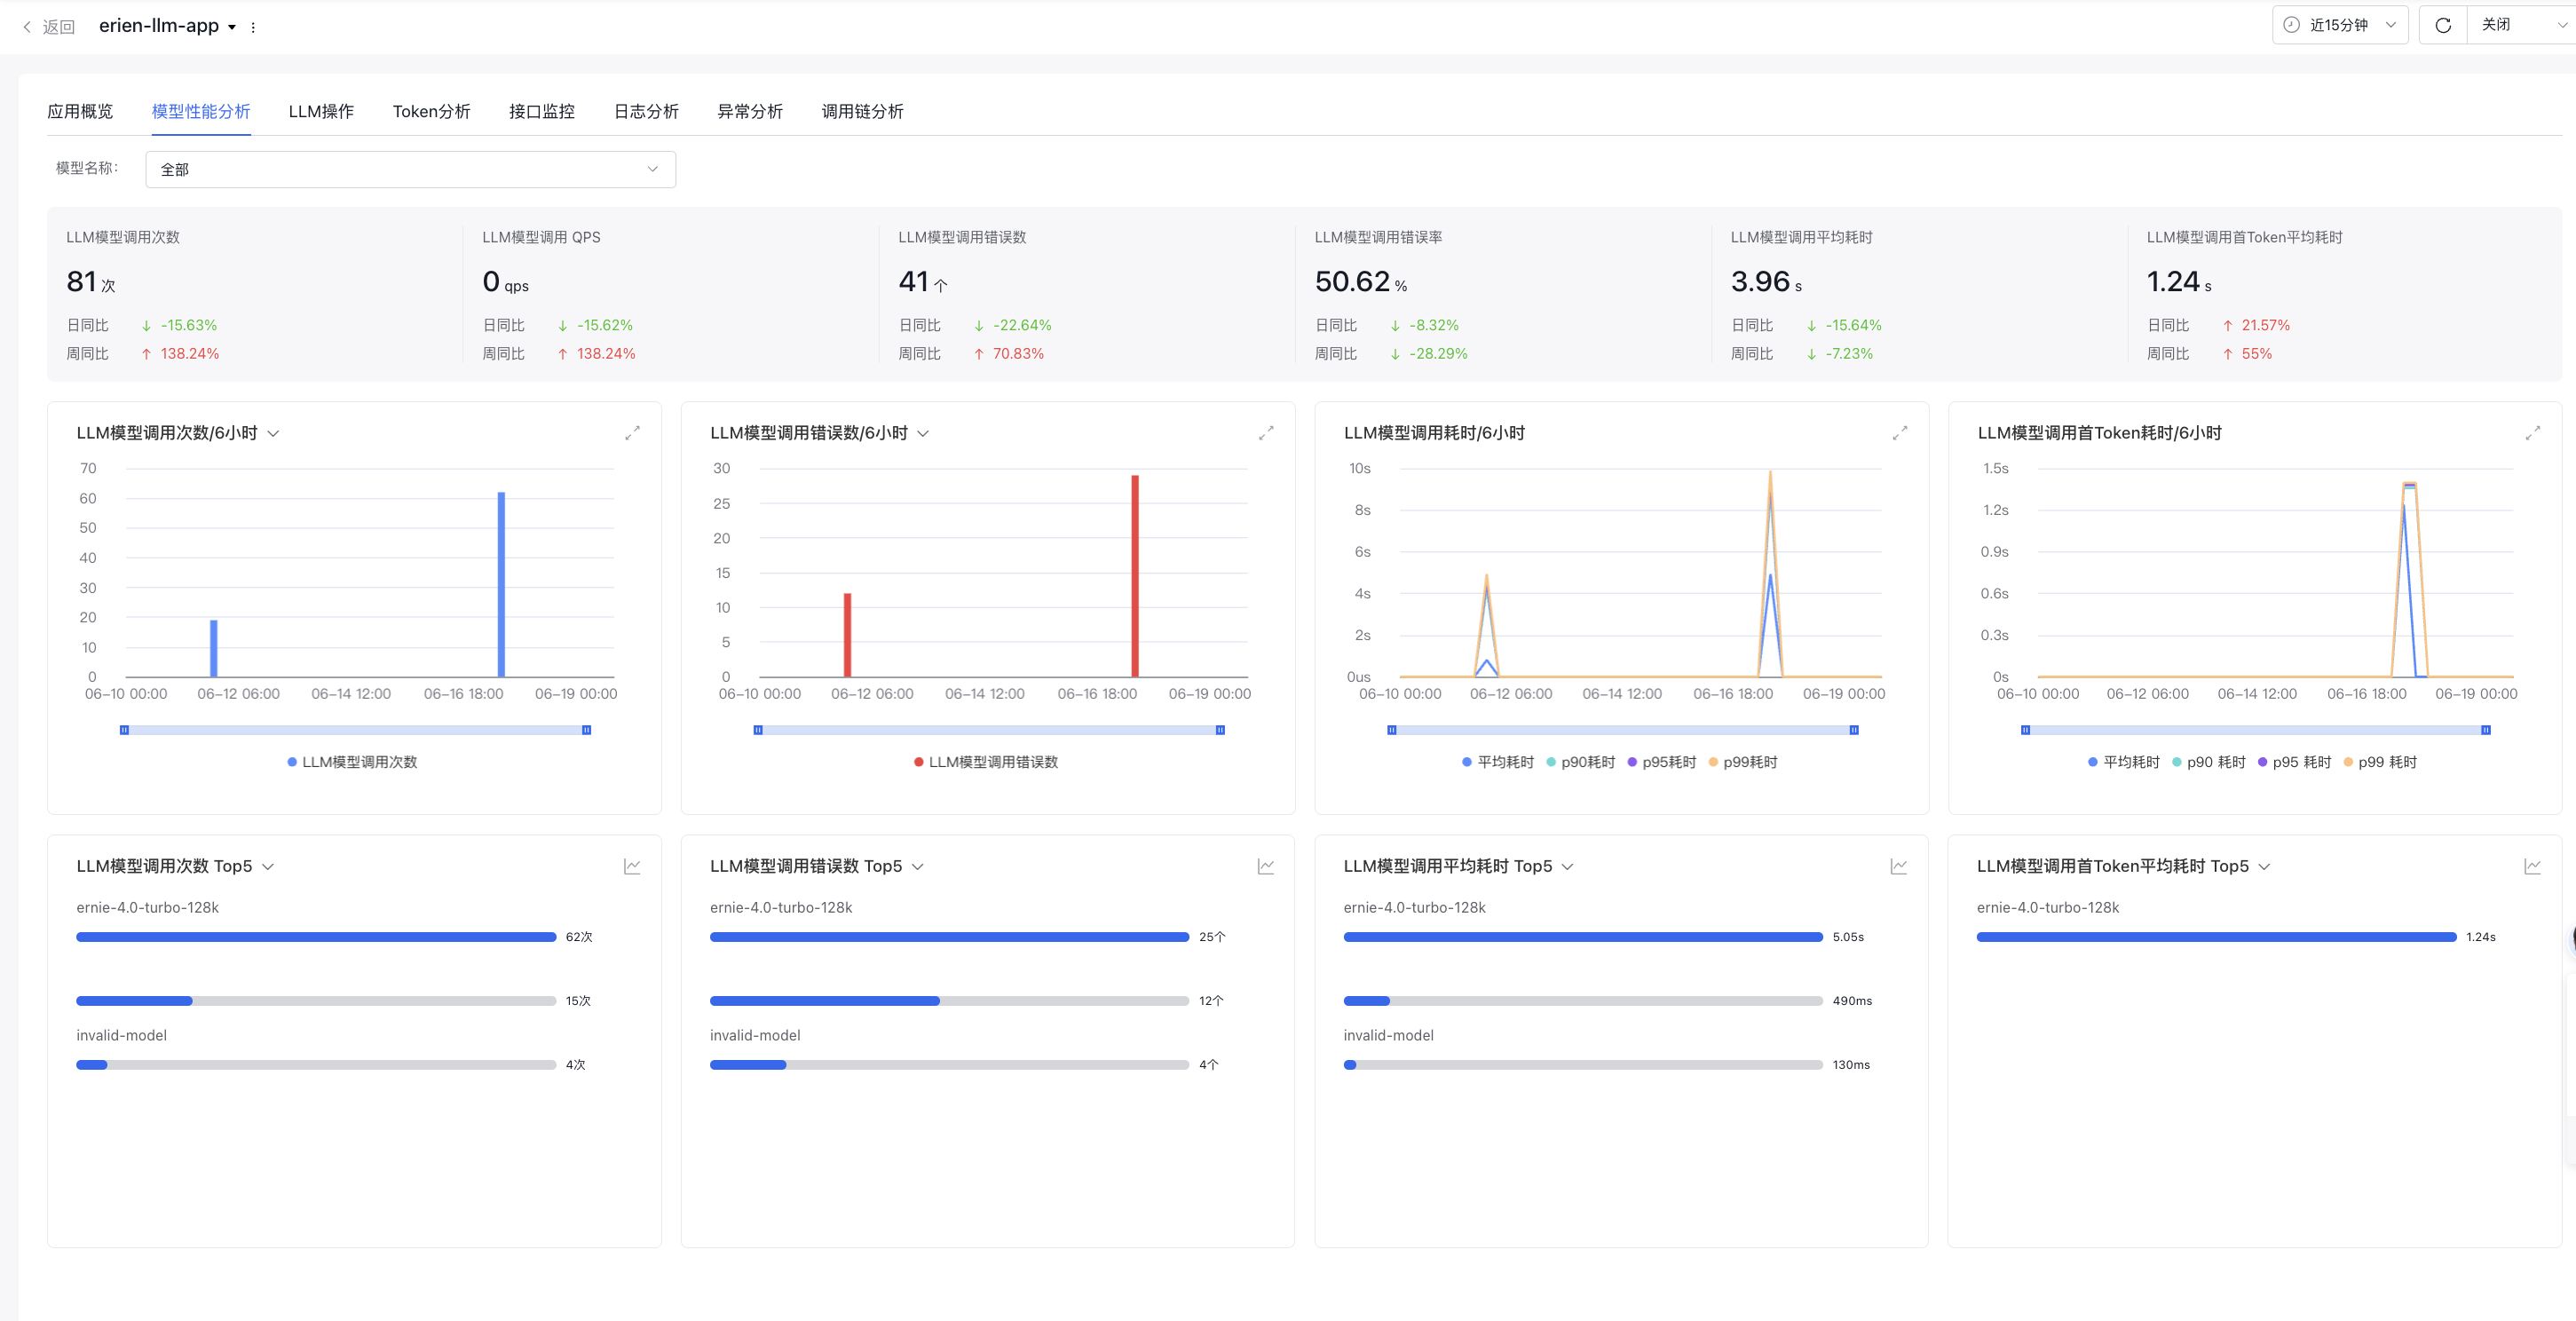
Model call analysis
Model call analysis shows detailed data on LLM large model calls for individual applications
Overview data:
Panel
Description
LLM call count
Display the count of large model calls across applications during the specified time period
LLM call QPS
Display the QPS of large model calls across applications during the specified time period
LLM call error count
Display the count of large model call errors across applications during the specified time period
LLM call error rate
Display the large model call error rate across applications during the specified time period
Average LLM call latency
Display the average latency of large model calls by applications during the specified time period
Average LLM call time-to-first-token latency
Display the average LLM call time-to-first-token latency during the specified time period, where time-to-first-token latency refers to the latency from the time when the user inputs the Query and then presses the Send button to the time when the first Token begins output in the last LLM model request
Large model call trend:
Panel
Description
Trend Chart of LLM Call Count
Display the LLM call count trend chart by default. Support switching LLM call QPS or Avg LLM call per request (average LLM call per user request)
Trend Chart of LLM Call Error Count
Display the LLM model call error count trend chart by default, where you can switch to LLM model call error rate trend chart
Trend Chart of LLM Call Latency
Display the latency trend chart for calling LLM, supporting Avg, p90, p95, and p99 latency
Trend Chart of LLM Call First-token Latency
Display the latency trend chart for LLM to call first token latency, supporting Avg, p90, p95, and p99 latency
Top 5 large model calls:
Panel
Description
Top 5 models with LLM model call counts
Based on all application calls to large models, statistics show the Top 5 large models in terms of the call count, with support for switching trend chart display It can switch to the Top 5 models in terms of LLM model call QPS, with support for switching trend chart It can switch to the Top 5 models in terms of Avg call per LLM request
Top 5 models with most LLM model call errors
Based on application calls to large models, statistics show the Top 5 large models with LLM call errors, with support for switching trend charts. It can switch to the Top 5 models in terms of LLM call error rate, with support for switching trend chart
Top 5 models with highest average LLM call latency
Based on application calls to large models, statistics show the Top 5 large models in terms of the average LLM call latency, with support for switching to other latency metrics such as p90, p95, and p99, and with support for switching trend chart
Top 5 models with highest LLM call time-to-first-token average latency
Based on application calls to large models, statistics show the Top 5 large models in terms of the LLM to call first token average latency, with support for switching to other latency metrics, and with support for switching trend chart
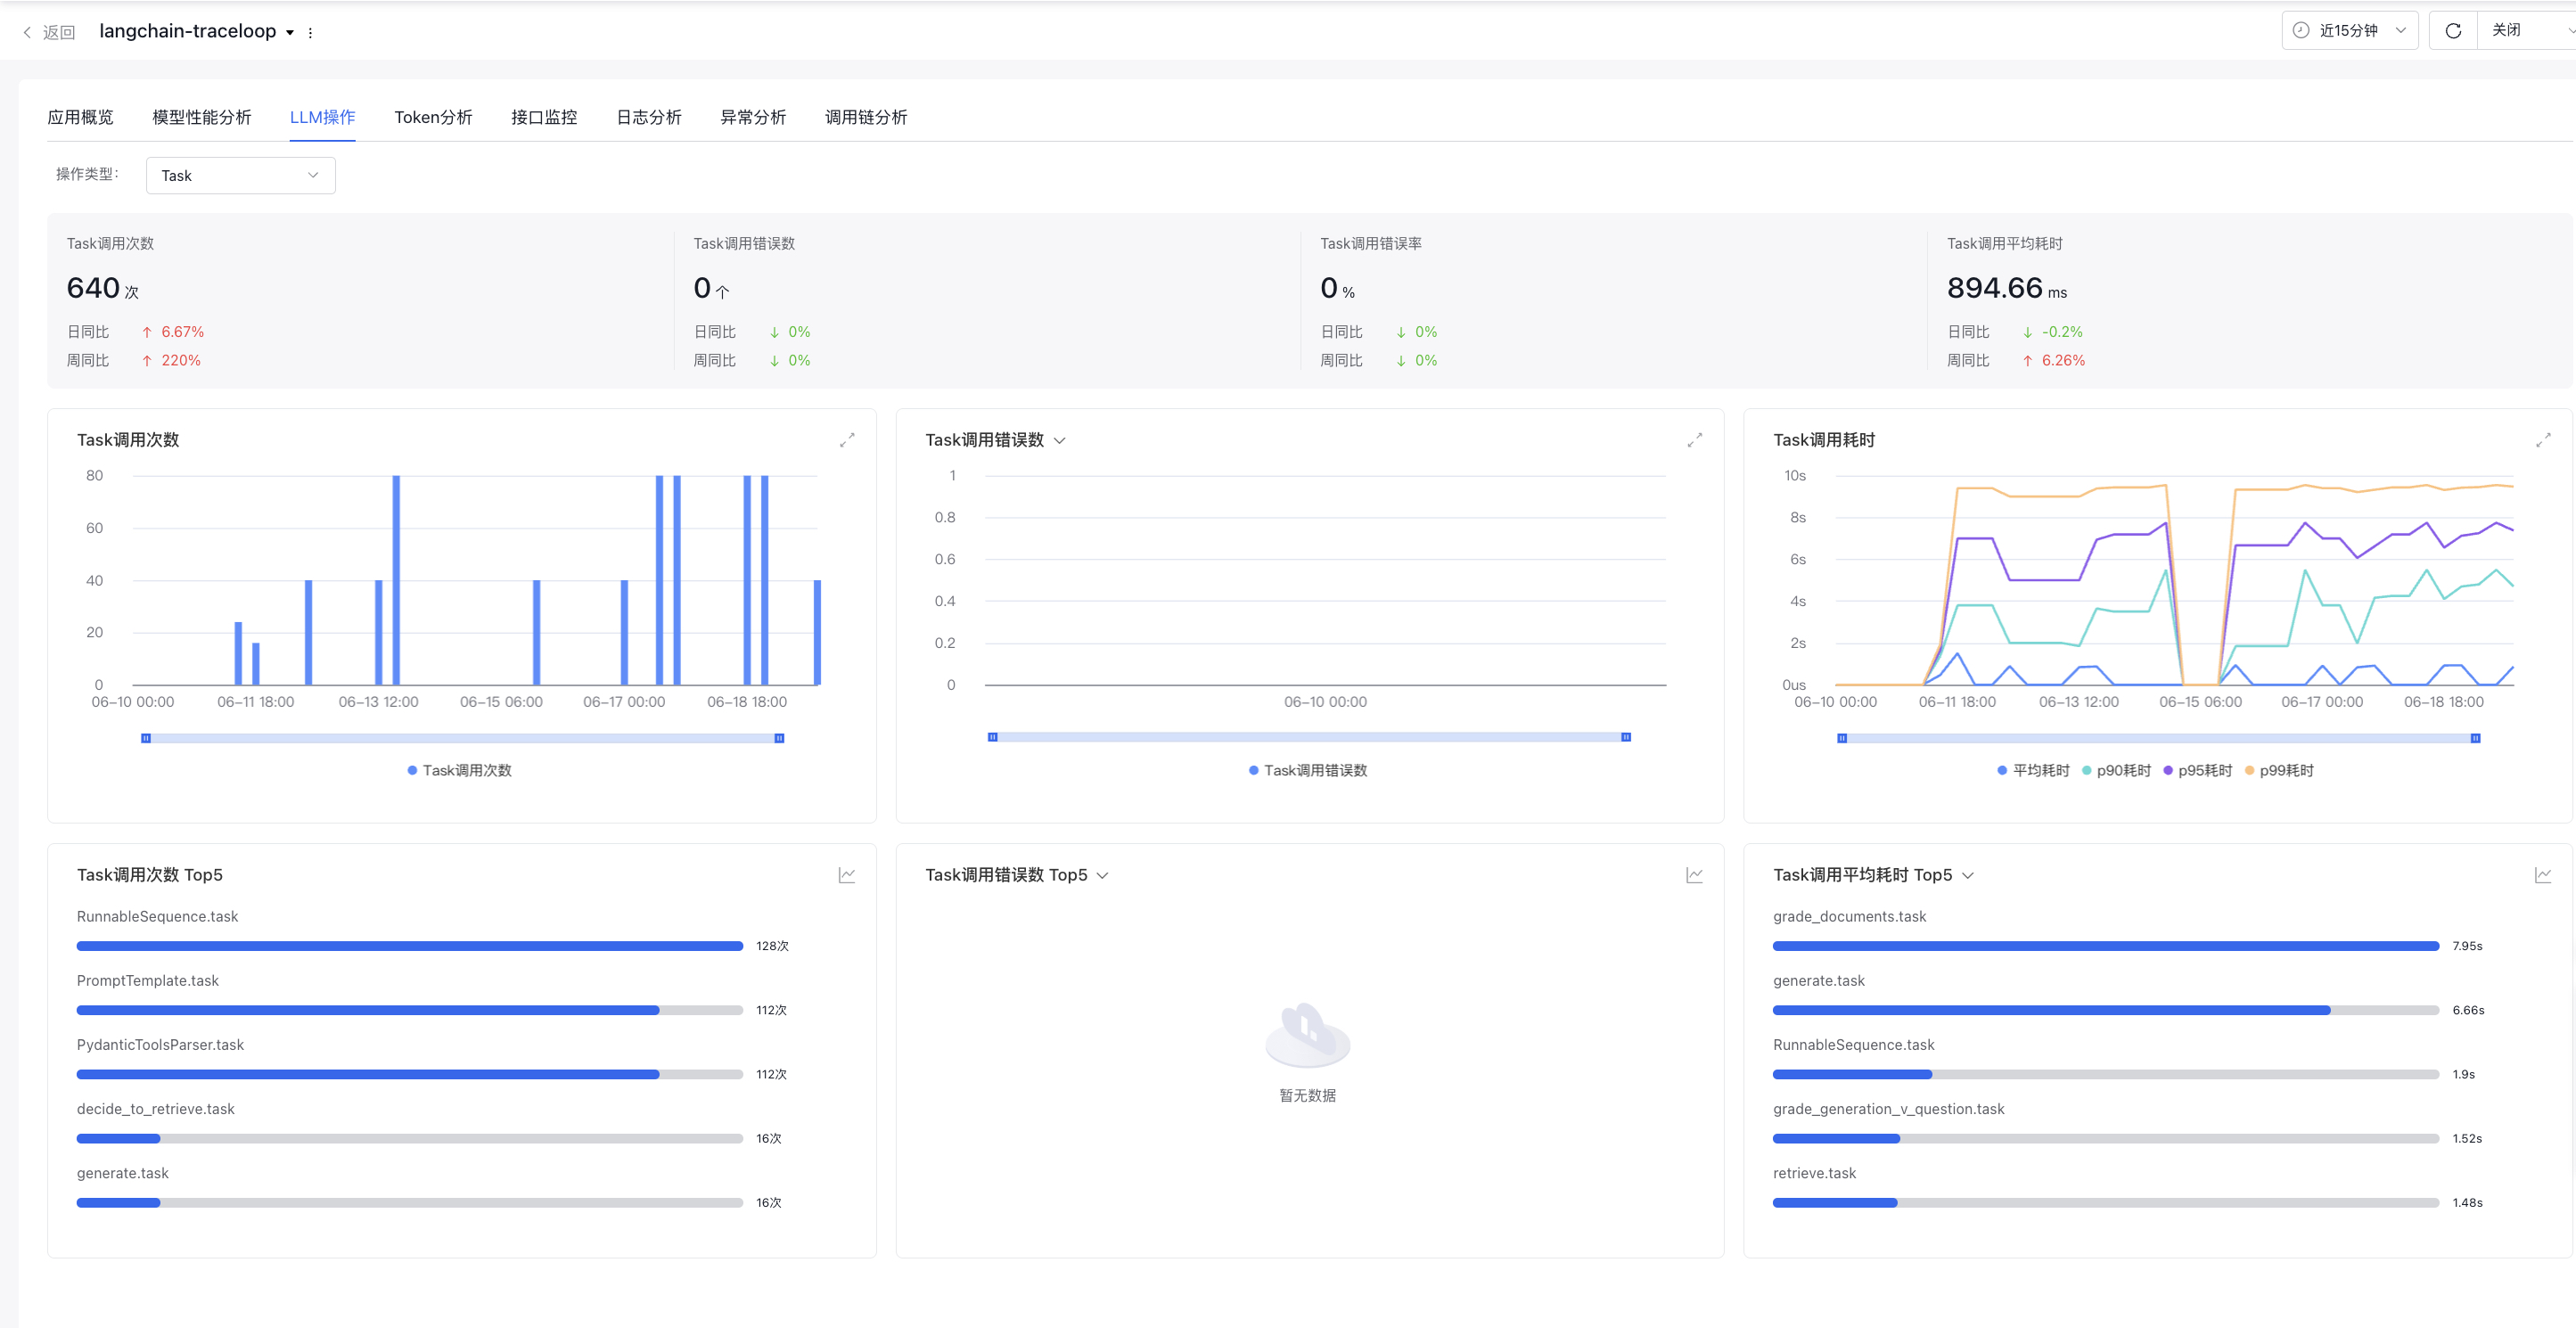
LLM operations
LLM operations show the data related to LLM operations for individual applications in detail. Operation types include seven operation types: Embedding, Agent, LLM, Task, Took, Workflow, and Rerank.
Filter criteria: Support operation type selection (the first one by default)
Overview data: Display relevant data for the selected operation types
Panel
Description
xx operation call count
Display the count of xx operation calls of applications during the specified time period
xx operation call error count
Display the error count of xx operation calls by applications during the specified time period
xx operation call error rate
Display the error rate of xx operation calls by applications during the specified time period
Average latency of xx operation calls
Display the average latency of xx operation calls by applications during the specified time period
Operation type call trend: Display call-related data for the selected operation type
Panel
Description
Trend Chart of xx Operation Call Count
Display the trend chart of xx operation call count
Trend Chart of xx Operation Call Error Count
Display the trend chart of xx operation call error count, supporting switching to trend chart of xx operation call error rate
Trend Chart of xx Operation Call Latency
Display the trend chart of xx operation call latency, supporting Avg, p90, p95, and p99 latency
Top 5 models with most operation types: Display the data of the top 5 models for the selected operation type, supporting switching to trend charts
Panel
Description
Top 5 models with most xx operation call counts
Statistics show the Top 5 models in terms of xx operation call count or the specific operation names, displaying the names of the Top 5 Embedding models, LLM models, Agent, Tool, Task, Rerank models, and Workflows.
Top 5 models with most xx operation call errors
Statistics show the Top 5 models with most xxx errors, supporting switching to the Top 5 models with highest xxx error rates via this dropdown
Top 5 models with highest xx operation call latency
Statistics show the Top 5 models with highest average xxx operation call latency, supporting switching to P90, P95, P99 latency
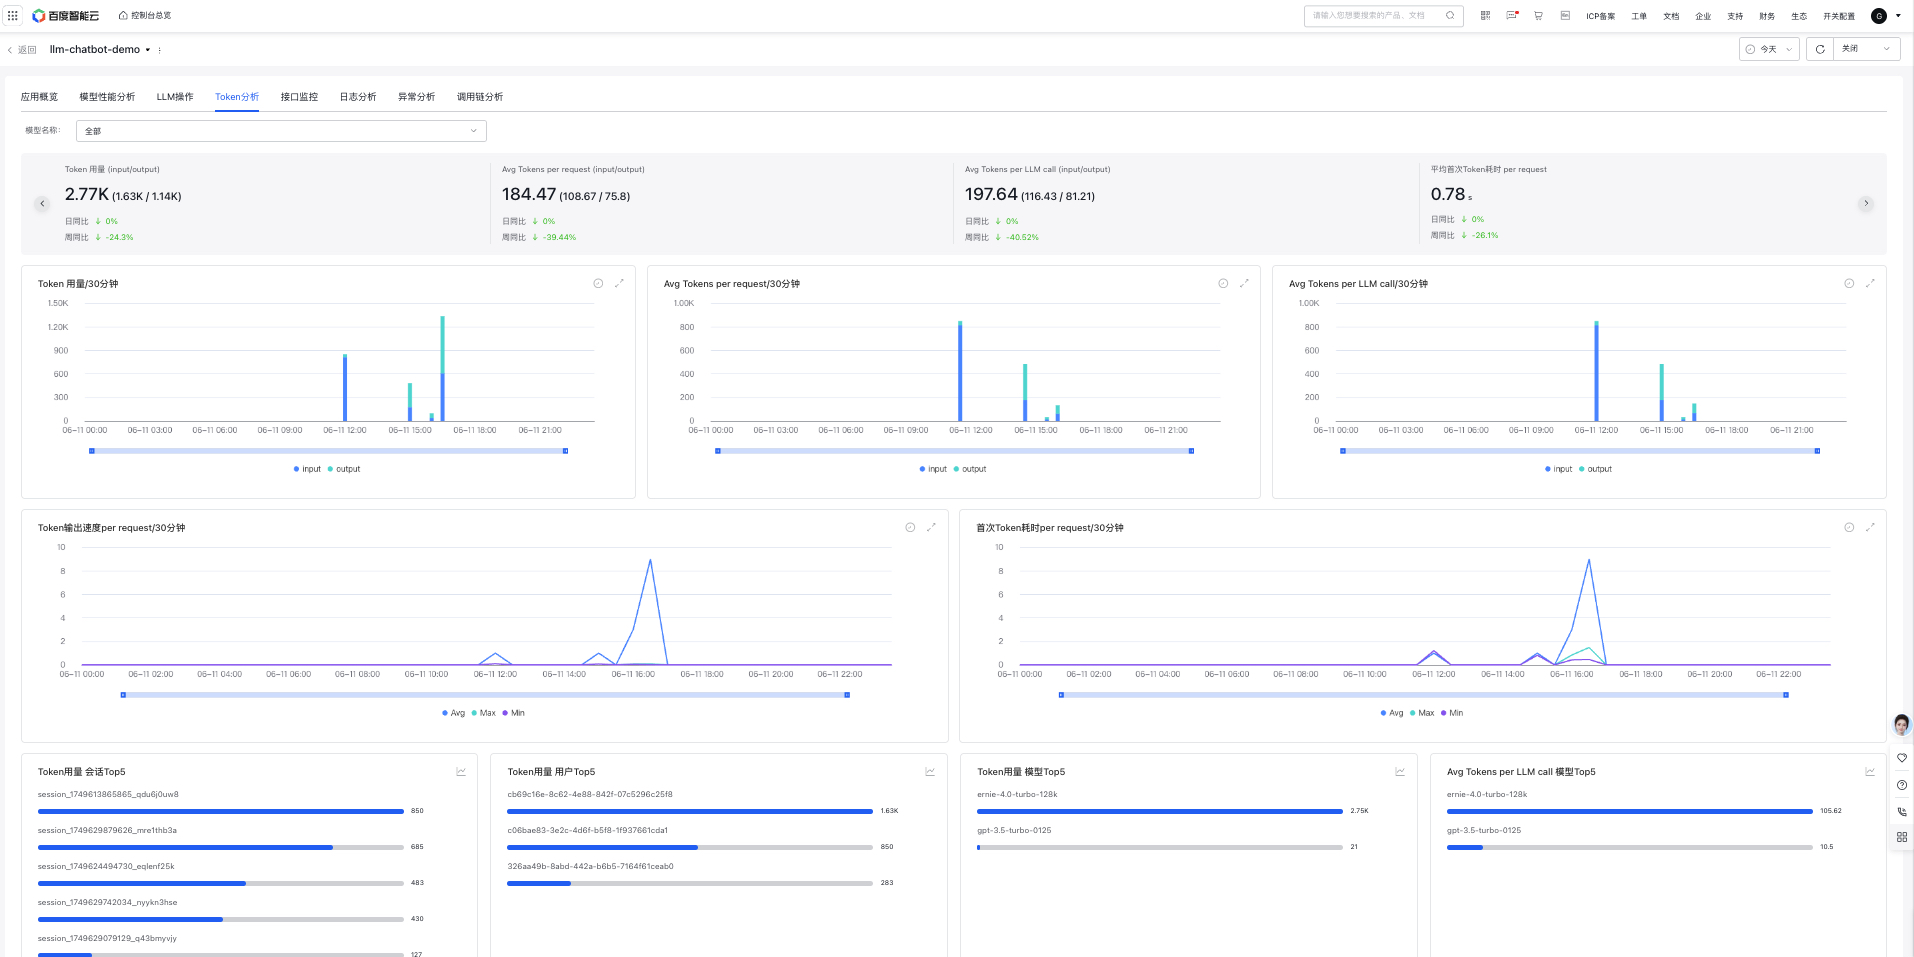
Token analysis
Token analysis displays token-related data for individual applications, supporting model filtering to view Token-related data for a specific model.
Filter criteria: Model name (default: all), supporting search and single selection.
Overview data:
Panel
Description
Token usage
Display token usage of applications during the specified period, including input and output
Avg Tokens per request
Display the average token usage per user request of applications during the specified period, including input and output
Avg Tokens per LLM call
Display the average token usage per LLM call by applications during the specified time period, with options to view input and output
Time-to-first-token average latency per request
Display the time-to-first-token average latency per user request during a specified time period, where time-to-first-token latency refers to the latency from the time when the user inputs the Query and then presses the Send button to the time when the first Token begins output in the last LLM model request
Trend Chart:
Panel
Description
Token Usage Trend
Display the token usage trend of all applications during the specified time period, with options to view input and output
Trend Chart of Average Tokens Per Request
Display the average token usage per user request of applications during the specified period
Trend of Average Tokens per LLM Call
Display the average token trend per LLM call by applications during the specified time period
Token output speed per request trend
Display the token output speed trend per user request during the specified period, where the speed refers to Token output count per request / request latency
Time-to-first-token latency per request
Display the latency of the first token of applications per user request during a specified time period, including Avg, p90, p95, and p99 latencies
Top 5 users with the most token usage:
Panel
Description
Top 5 sessions with most token usage
Statistics show the Top 5 sessions (Session) with the most token usage, supporting trend chart switching
Top 5 users with most token usage
Statistics show the Top 5 users with the most token usage, supporting trend chart switching
Top 5 models with most token usage
Statistics show the Top 5 large models with the most token usage, supporting trend chart switching
Top 5 models with most average tokens per LLM call
Statistics show the Top 5 large models with "Avg Tokens per LLM call," supporting trend chart switching