
Application Access
Overview
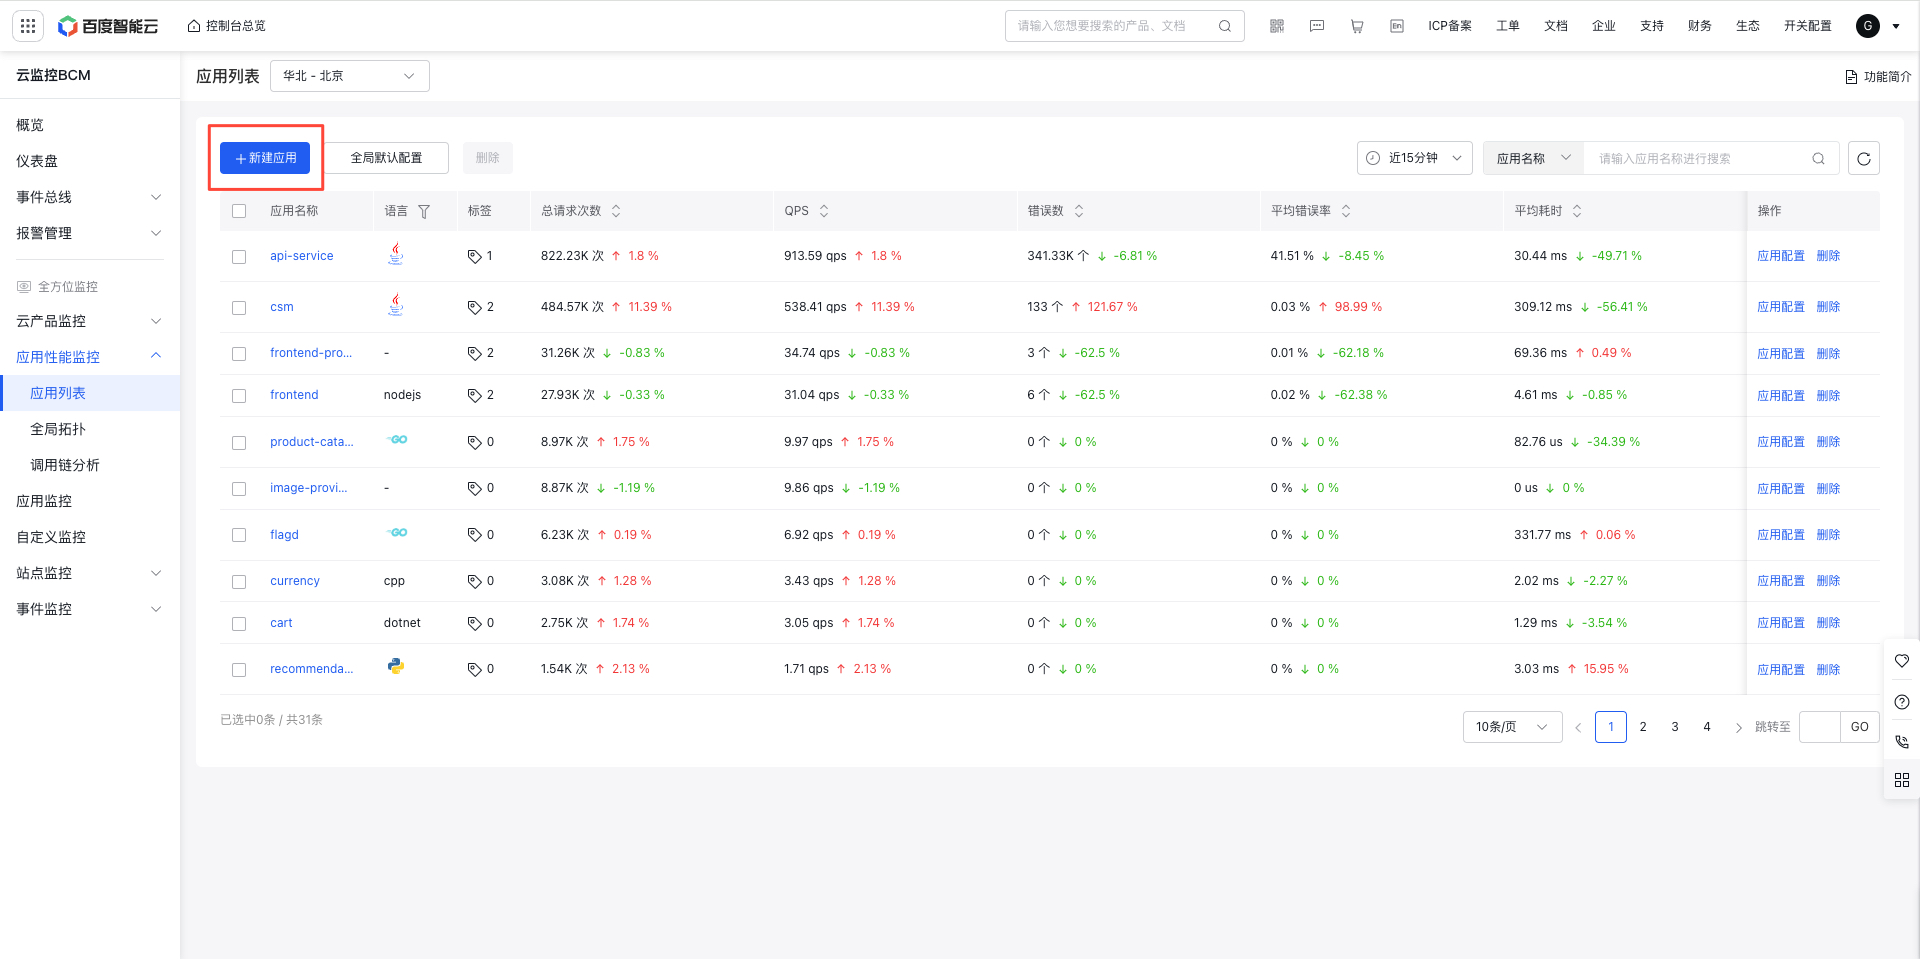
Currently support Java, Go, and Python languages, and be compatible with OpenTelemetry protocol. More languages and protocols will be supported in the future Entry: Application Performance Monitor -> Application List -> Create New Application to redirect to the Application Onboarding page
Onboarding process
Click to enter the Application Onboarding page, where you can switch between languages to view the onboarding process. After onboarding as guided, the onboarded application will appear in Application Performance Monitor -> Application List.
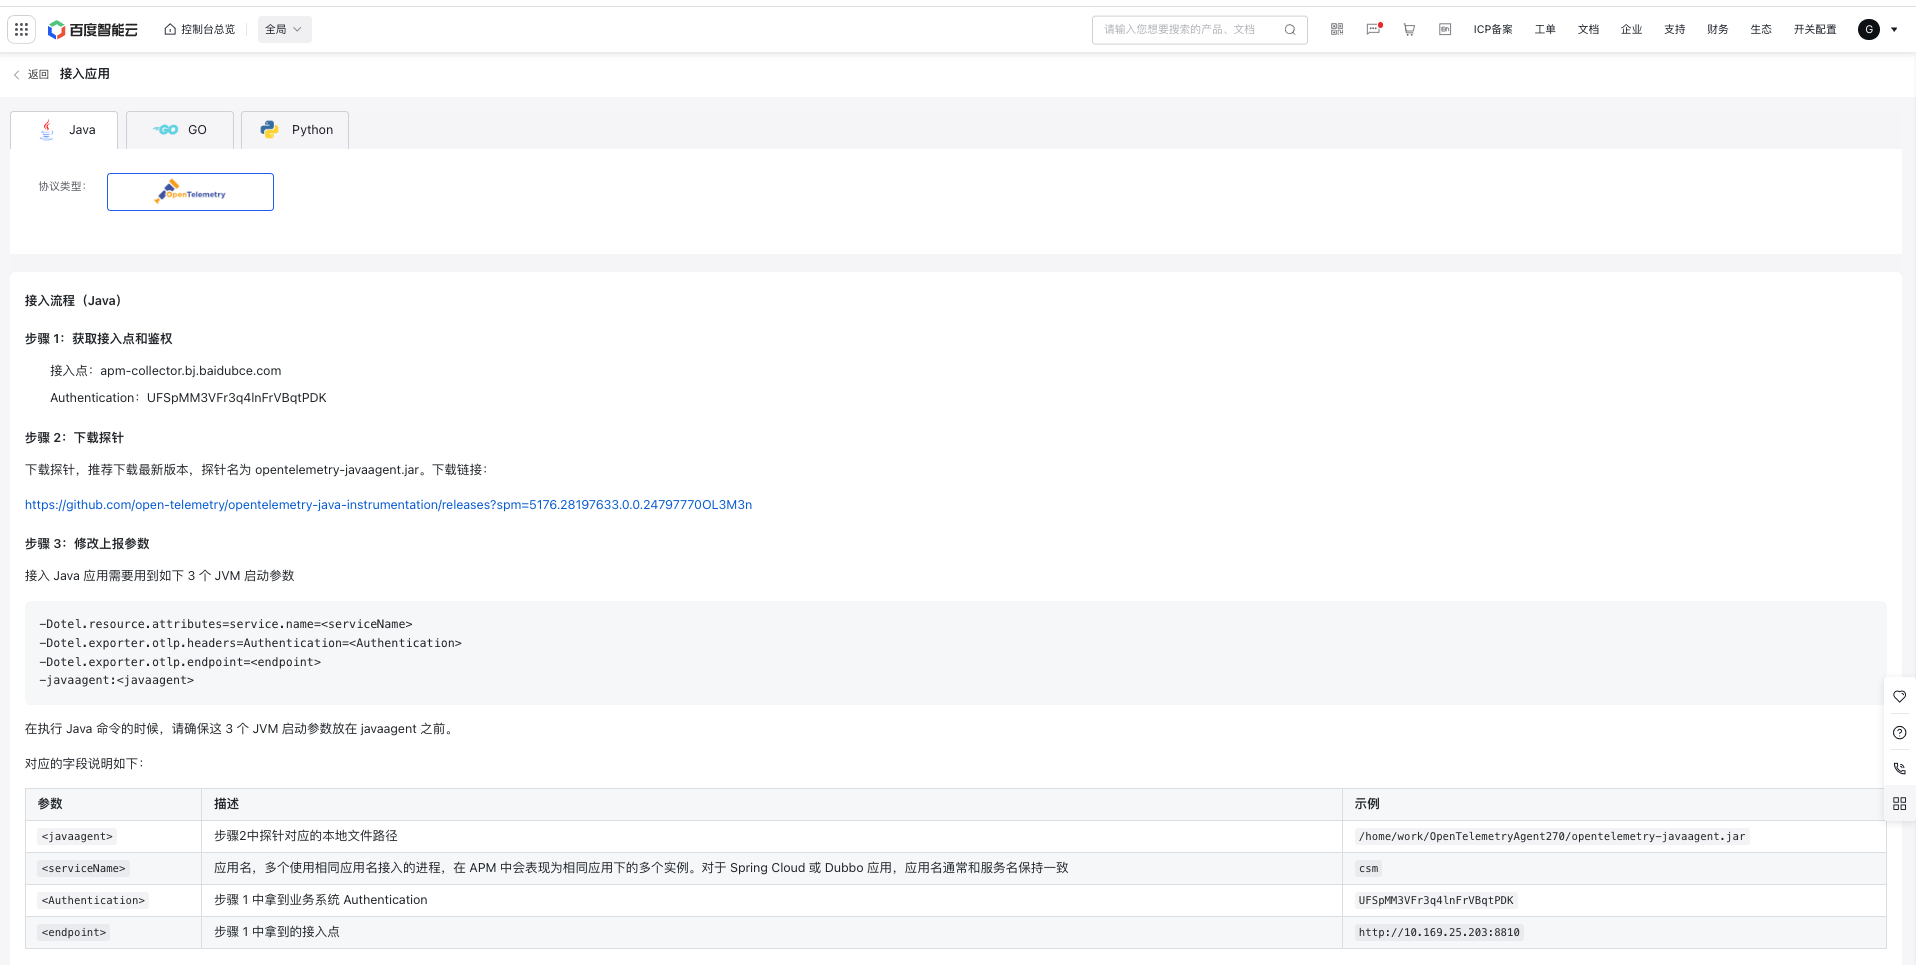
Java application onboarding
Step 1: Retrieve the endpoint and authentication (this information varies by region and user and can be obtained on the “Onboard Application” page in the console; an example is provided below)
- Endpoint: apm-collector.bj.baidubce.com
- Authentication:UFSpMM***lnFrVBqtPDK
Step 2: Download the agent
Download the agent. Latest version is recommended. The agent is named opentelemetry-javaagent.jar. Download link: https://github.com/open-telemetry/opentelemetry-java-instrumentation/releases?spm=5176.28197633.0.0.24797770OL3M3n
Step 3: Modify reporting parameters
Onboarding Java applications requires the following 3 JVM startup parameters:
-Dotel.resource.attributes=service.name=<serviceName>
-Dotel.exporter.otlp.headers=Authentication=<Authentication>
-Dotel.exporter.otlp.endpoint=<endpoint>
-javaagent:<javaagent>
-Dotel.logs.exporter=none
When executing Java commands, ensure these 3 JVM startup parameters are placed before javaagent. Corresponding fields are described as follows:
| Parameters | Description | Example |
|---|---|---|
| <javaagent> | Local file path corresponding to the agent in Step 2 | /home/work/OpenTelemetryAgent270/opentelemetry-javaagent.jar |
| <serviceName> | Application name: If multiple processes use the same application name, they will appear as separate instances under the same application in APM. For Spring Cloud or Dubbo applications, the application name is generally consistent with the service name. | csm |
| <Authentication> | Application system authentication obtained in Step 1 | UFSpMM***lnFrVBqtPDK |
| <endpoint> | Endpoint obtained in Step 1 | http://10.169.25.203:8810 |
Step 4: Onboard verification
After completing the 3 onboarding steps, start the Java application, which will mount the probe and connect to Baidu AI Cloud APM service to report monitor data. With normal traffic, onboarded applications will appear in Application Performance Monitor - Application List. Due to processing latency, if no application can be queried in the console after onboarding, please wait approximately 30 seconds.
Go application onboarding
Step 1: Retrieve the endpoint and authentication (endpoint and authentication details are region-specific and user-specific; check the console for accurate information)
- Endpoint: http://10.169.25.203:8810
- Authentication:UFSpMM***lnFrVBqtPDK
Step 2: Add OpenTelemetry dependencies and implement the SDK initialization logic
import (
    "context"
    "errors"
    "io"
    "log"
    "net"
    "os"
    "time"
    "net/http"
    "os/signal"
    "go.opentelemetry.io/contrib/instrumentation/net/http/otelhttp"
    "go.opentelemetry.io/otel"
    "go.opentelemetry.io/otel/attribute"
    "go.opentelemetry.io/otel/exporters/otlp/otlptrace"
    "go.opentelemetry.io/otel/exporters/otlp/otlptrace/otlptracehttp"
    "go.opentelemetry.io/otel/propagation"
    "go.opentelemetry.io/otel/sdk/resource"
    sdktrace "go.opentelemetry.io/otel/sdk/trace"
)
func setupOTelSDK(ctx context.Context) (shutdown func(context.Context) error, err error) {
    var shutdownFuncs []func(context.Context) error
    shutdown = func(ctx context.Context) error {
        var err error
        for _, fn := range shutdownFuncs {
            err = errors.Join(err, fn(ctx))
        }
        shutdownFuncs = nil
        return err
    }
    headers := map[string]string{"Authentication": "<Authentication>"} // Replace <Authentication> with the application system Authentication
    opts := []otlptracehttp.Option{
        otlptracehttp.WithHeaders(headers),
        otlptracehttp.WithEndpoint("<endpoint>"), // <endpoint> Enter the reporting address, omitting the http:// prefix
        otlptracehttp.WithInsecure(),
    }
    client := otlptracehttp.NewClient(opts...)
    if err != nil {
        log.Fatal(err)
    }
    r, err := resource.New(ctx, []resource.Option{
        resource.WithAttributes(
            attribute.KeyValue{Key: "service.name", Value: attribute.StringValue("<serviceName>")}, // Replace <serviceName> with application name
            attribute.KeyValue{Key: "host.name", Value: attribute.StringValue("<hostName>")},       // <hostName> Replace with an IP address
        ),
    }...)
    if err != nil {
        log.Fatal(err)
    }
    traceExp, err := otlptrace.New(ctx, client)
    if err != nil {
        log.Fatal(err)
    }
    bsp := sdktrace.NewBatchSpanProcessor(traceExp)
    tp := sdktrace.NewTracerProvider(
        sdktrace.WithSampler(sdktrace.AlwaysSample()),
        sdktrace.WithSpanProcessor(bsp),
        sdktrace.WithResource(r),
    )
    otel.SetTracerProvider(tp)
    otel.SetTextMapPropagator(propagation.NewCompositeTextMapPropagator(propagation.TraceContext{}, propagation.Baggage{}))
    return
}
Step 3: Initialize SDK and start HTTP service
func main() {
    if err := run(); err != nil {
        log.Fatalln(err)
    }
}
func run() (err error) {
    ctx, stop := signal.NotifyContext(context.Background(), os.Interrupt)
    defer stop()
    // Initialize SDK
    otelShutdown, err := setupOTelSDK(ctx)
    if err != nil {
        return
    }
    // Graceful shutdown
    defer func() {
        err = errors.Join(err, otelShutdown(context.Background()))
    }()
    // Start HTTP service
    srv := &http.Server{
        Addr:         ":8080",
        BaseContext:  func(_ net.Listener) context.Context { return ctx },
        ReadTimeout:  time.Second,
        WriteTimeout: 10 * time.Second,
        Handler:      newHTTPHandler(),
    }
    srvErr := make(chan error, 1)
    go func() {
        srvErr <- srv.ListenAndServe()
    }()
    select {
    case err = <-srvErr:
        return
    case <-ctx.Done():
        stop()
    }
    err = srv.Shutdown(context.Background())
    return
}
Step 4: Enhance instrumentation for HTTP APIs
func newHTTPHandler() http.Handler {
    mux := http.NewServeMux()
    handleFunc := func(pattern string, handlerFunc func(http.ResponseWriter, *http.Request)) {
        // Instrument HTTP routes
        handler := otelhttp.WithRouteTag(pattern, http.HandlerFunc(handlerFunc))
        mux.Handle(pattern, handler)
    }
    // Register API
    handleFunc("/simple", simpleIOHandler)
    // Enhance instrumentation for all APIs
    handler := otelhttp.NewHandler(mux, "/")
    return handler
}
func simpleIOHandler(w http.ResponseWriter, r *http.Request) {
    io.WriteString(w, "ok")
}
Step 5: Onboard verification
After starting the Go application, access the corresponding API via port 8080, for example: curl -X POST http://localhost:8080/simple -H "Content-Type: application/json", the application will then report chain data related to the HTTP request processing to APM. With normal traffic, onboarded applications will be displayed under Application Performance Monitor - Application List. Due to processing latency, if no application can be queried in the console after onboarding, please wait approximately 30 seconds.
Python application onboarding
Step 1: Retrieve the endpoint and authentication (endpoint and authentication details are region-specific and user-specific; for details, refer to relevant page)
- Endpoint: http://10.169.25.203:8810
- Authentication:UFSpMM***lnFrVBqtPDK
Step 2: Install required dependency packages
pip install opentelemetry-instrumentation-redis
pip install opentelemetry-instrumentation-mysql
pip install opentelemetry-distro opentelemetry-exporter-otlp
opentelemetry-bootstrap -a install
Step 3: Modify reporting parameters
Create an app.py file and enter the following sample code
from flask import Flask
import requests
import time
backend_addr = 'https://example.com/'
app = Flask(__name__)
# Access external site
@app.route('/')
def index():
    start = time.time()
    r = requests.get(backend_addr)
    return r.text
# Access database
@app.route('/mysql')
def func_rdb():
    return "rdb res"
# Access redis
@app.route("/redis")
def func_kvop():
    return "kv res"
app.run(host='0.0.0.0', port=8080)
Start Python application as follows:
opentelemetry-instrument \
--traces_exporter otlp \
--service_name <serviceName> \
--exporter_otlp_endpoint <endpoint> \
--exporter_otlp_protocol http/protobuf \
--exporter_otlp_headers Authentication=<Authentication> \
--resource_attributes host.name=<hostName> \
python3 app.py
Corresponding fields are described as follows:
| Parameters | Description | Example |
|---|---|---|
| <serviceName> | Application name: If multiple processes use the same application name, they will appear as separate instances under the same application in APM. For Spring Cloud or Dubbo applications, the application name is generally consistent with the service name. | csm |
| <Authentication> | Application system authentication obtained in Step 1 | UFSpMM***lnFrVBqtPDK |
| <endpoint> | Endpoint obtained in Step 1 | http://10.169.25.203:8810 |
| <hostName> | The hostname of the instance serves as the unique identifier for the application instance and is usually set as the IP address of the application instance. | my-instance-host |
Step 4: Onboard verification
After starting the Python application, access the corresponding API via port 8080, for example: curl http://localhost:8081/mysql -H "Content-Type: application/json". With normal traffic, onboarded applications will be displayed under Application Performance Monitor - Application List. Due to processing latency, if no application can be queried in the console after onboarding, please wait approximately 30 seconds.