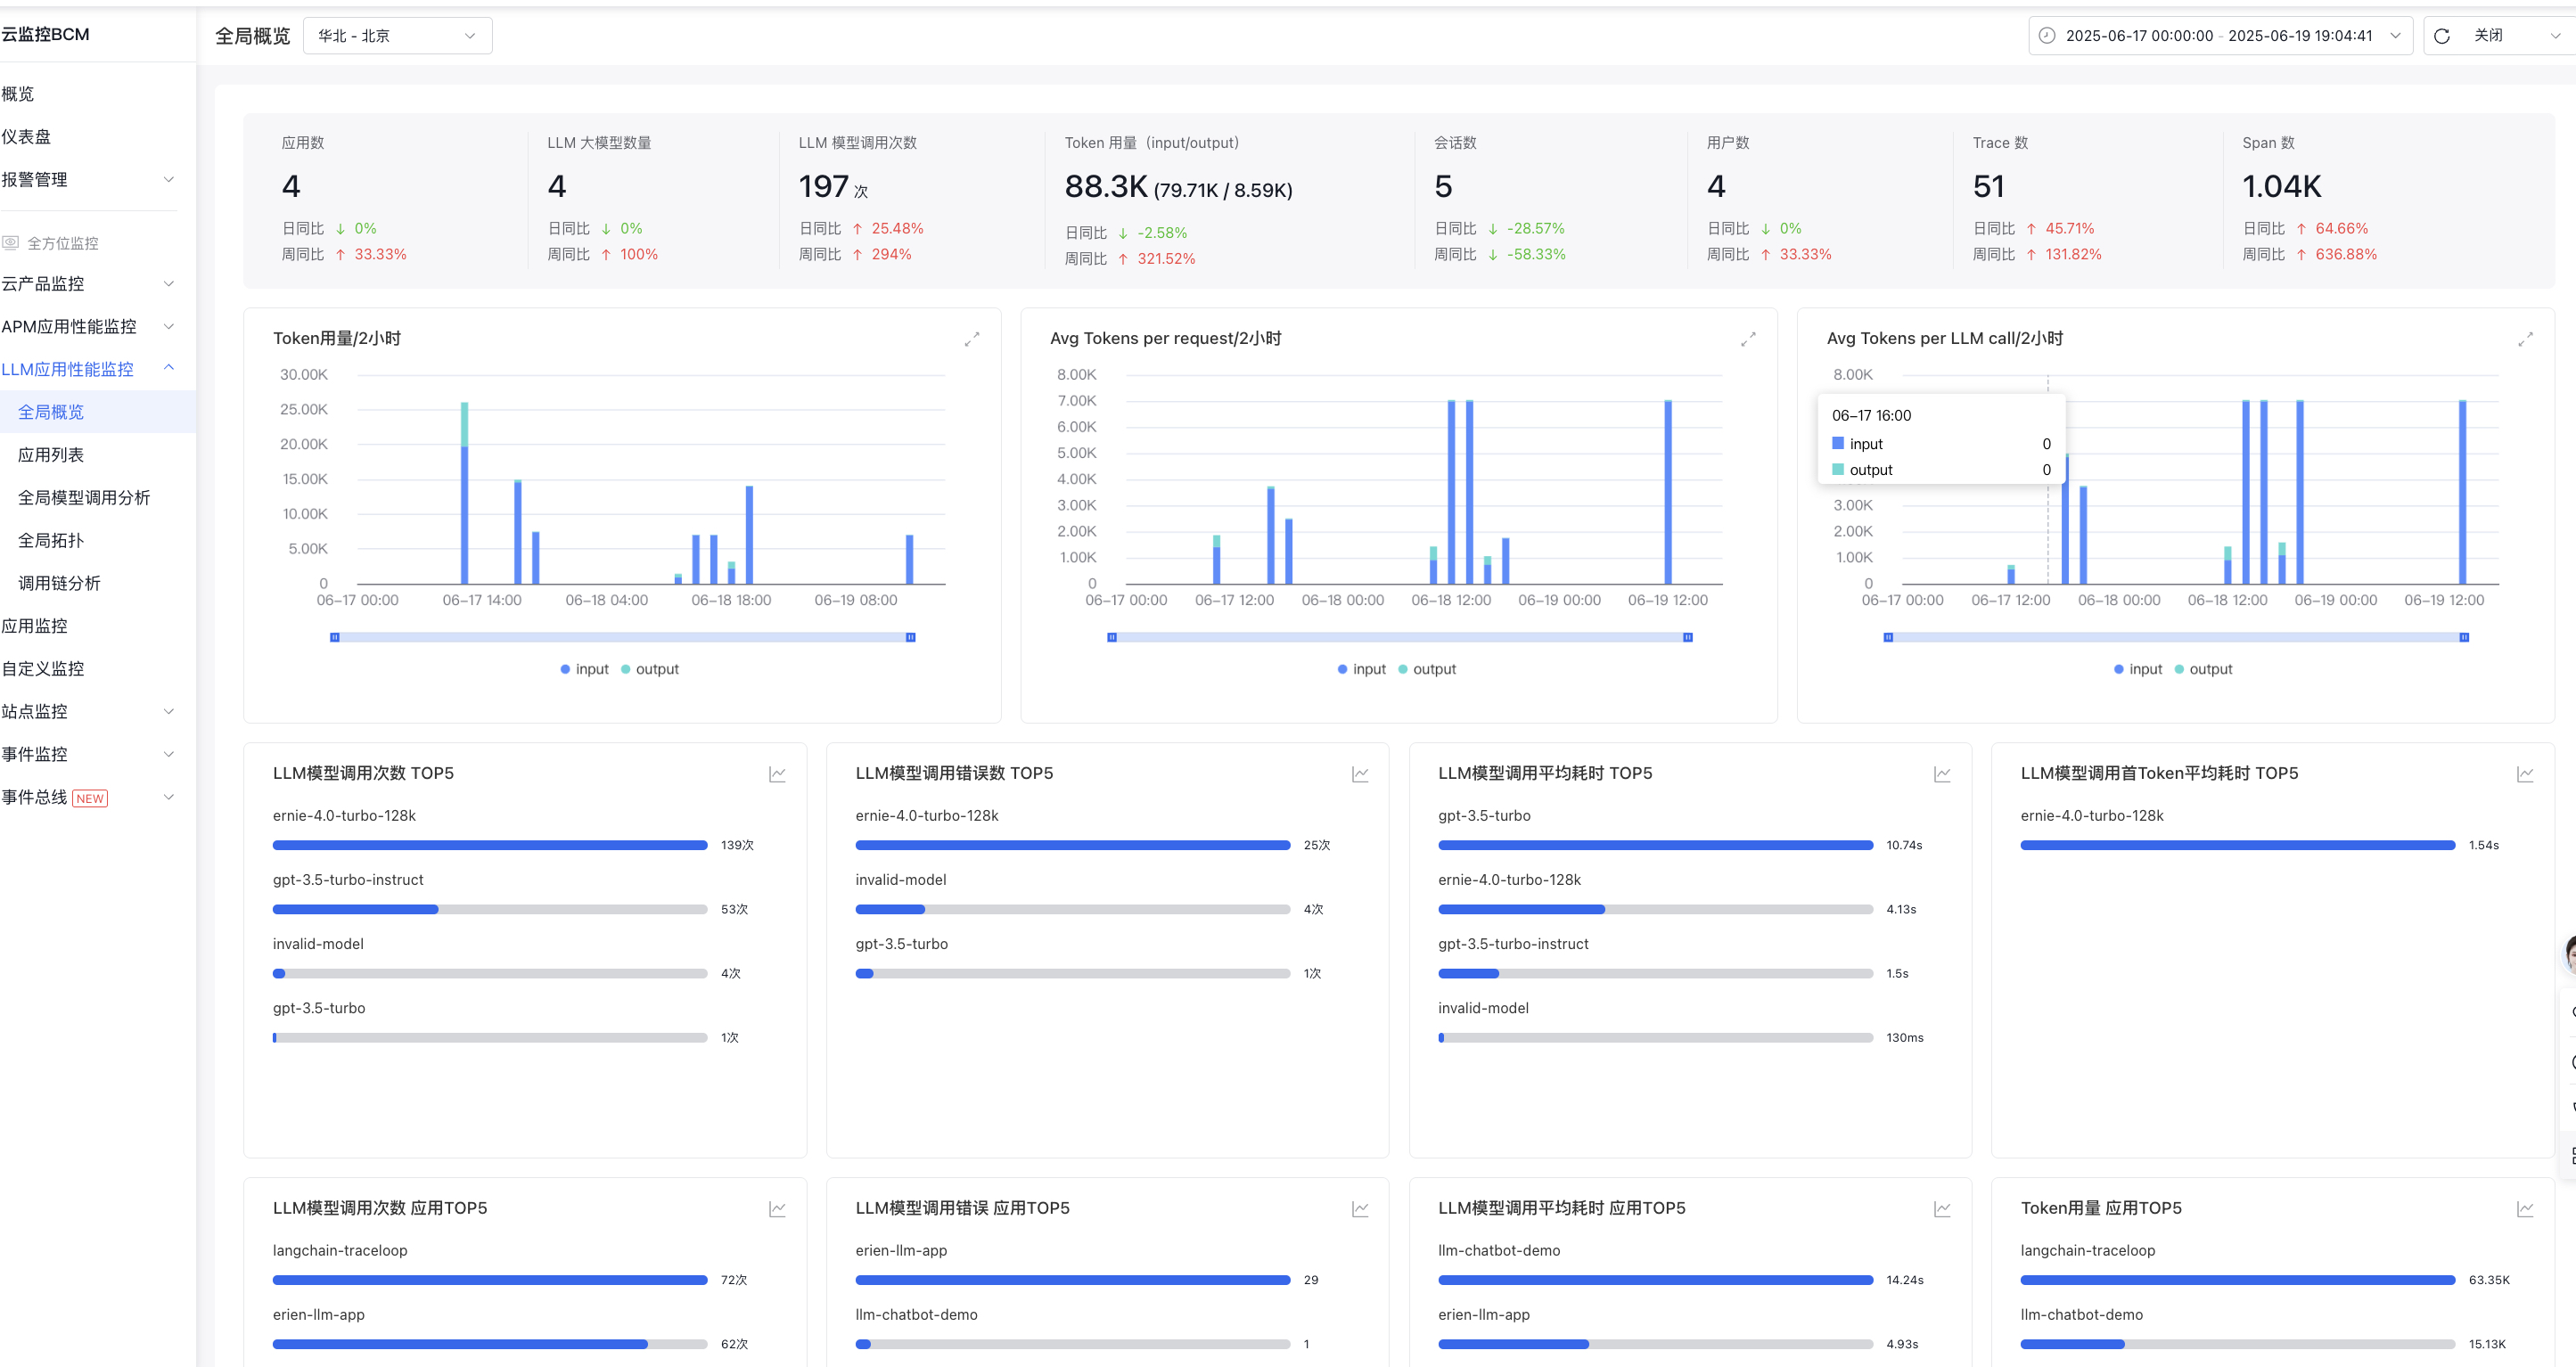
Global overview displays aggregated analytical data for all LLM applications, including LLM calls and token analysis.
Overview data:
Panel
Description
Application count
Count of large model applications that have been integrated
LLM count
Count of large model used by all applications during the specified time period
LLM call count
Count of large model calls generated by all applications during the specified time period
Token usage
Token usage generated by all applications within a specified time period
User count
Count of large model users during the specified time period
Trace count
Count of call chains generated by all applications during the specified time period
Span count
Count of spans generated by all applications during the specified time period
Token Usage Metric Trend Chart:
Panel
Description
Token Usage Trend Chart
Display the trend chart of token usage for all applications, categorized by input and output
Trend Chart of Average Tokens Per Request
Display the trend chart of average token usage per user request across all applications, categorized by input and output
Trend Chart of Average Tokens Per LLM Call
Display the average token usage per LLM call across all applications, categorized by input and output
Top 5 LLM call:
Panel
Description
Top 5 LLM call count
Based on all application calls to large models, statistics show the Top 5 large models in terms of the call count, with support for switching trend chart display
Top 5 LLM call errors
Based on all application calls to large models, statistics show the Top 5 large models in terms of the call error, with support for switching trend chart display
Top 5 average LLM call latency
Based on all application calls to large models, statistics show the Top 5 large models in terms of the average call error latency, with support for switching trend chart display
Top 5 average LLM call time-to-first-token latency
Based on all application calls to large models, statistics show the Top 5 large models in terms of the first token call average latency, with support for switching trend chart display
Top 5 application rankings:
Panel
Description
Top 5 applications by LLM call count
Based on all application calls to large models, statistics show the Top 5 applications in terms of the large model call count, with support for switching trend chart display
Top 5 applications by LLM call errors
Based on all application calls to large models, statistics show the Top 5 applications in terms of the large model call error, with support for switching trend chart display
Top 5 applications by average LLM call latency
Based on all application calls to large models, statistics show the Top 5 applications in terms of the large model call average latency, with support for switching trend chart display
Top 5 applications by average LLM call time-to-first-token latency
Based on all application calls to large models, statistics show the Top 5 applications in terms of the large models to call the average first token latency, with support for switching trend chart display