Application Performance Monitor
Application overview page
The application overview page displays core server-side metrics such as slow calls, slow SQL, and total exceptions, helping users quickly identify abnormal metrics
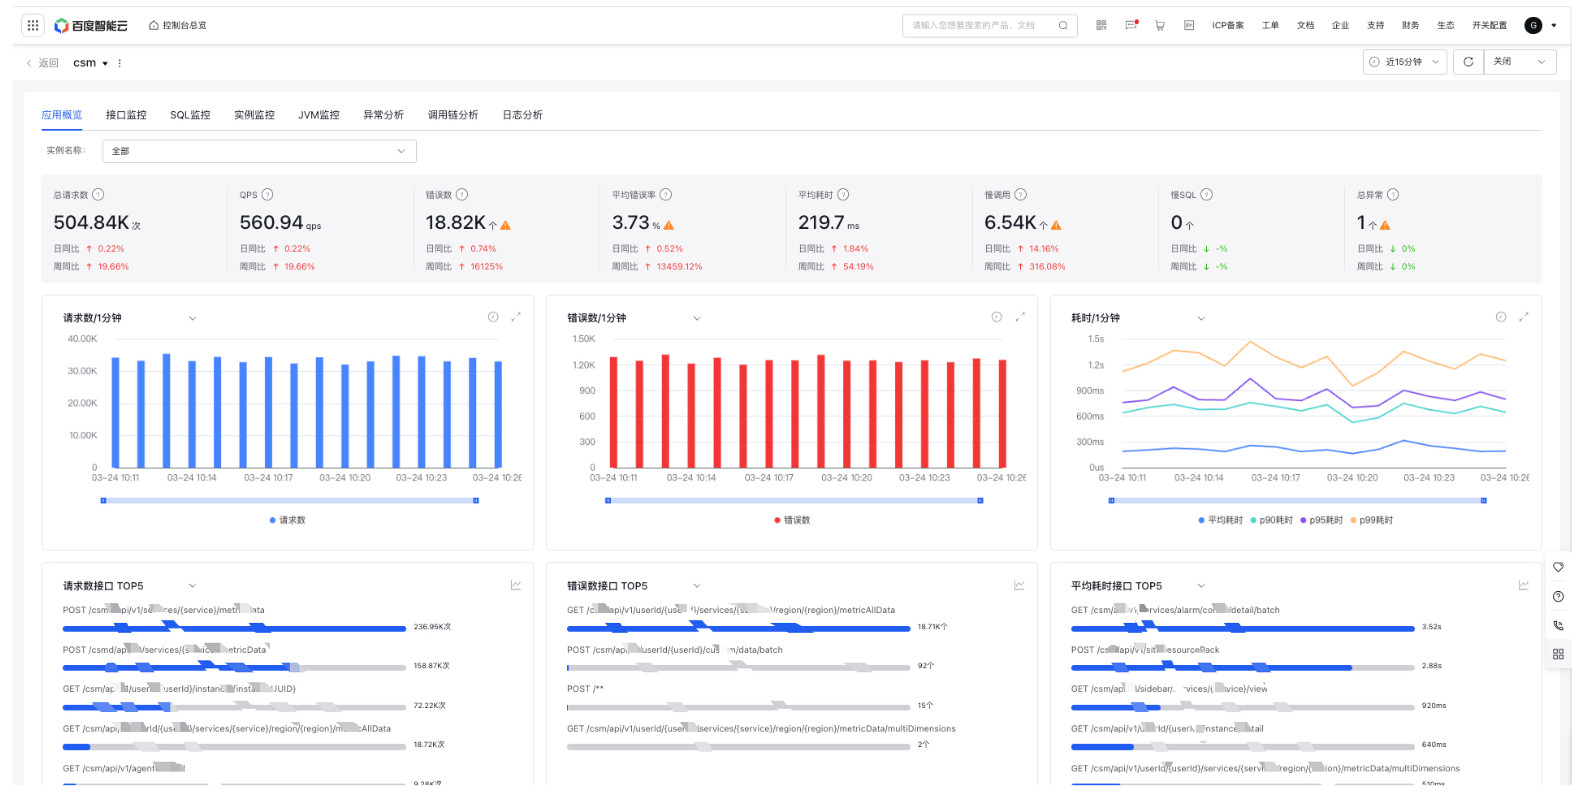
- Filter criteria: Support instance filtering. By default, all application dimension data is displayed; selecting a single instance shows instance-specific data
- Aggregated data: Display total server requests, server QPS, server errors, average server error rate, average server latency, slow server calls (based on user-configured thresholds in application settings), slow SQL queries (based on user-configured thresholds in application settings), and total exceptions. Clicking on error count, slow calls, slow SQL, or exceptions will navigate to the Trace Explorer tab to view related traced call chain data
- Monitor trend chart: Display server-side total requests, QPS, error count, average error rate, and latency trends, and support year-over-year, month-over-month, and custom date comparisons
- Server-side Top 5 APIs: Display server-side request count (switchable to QPS), error count, error rate, and latency (avg, p90, p95, p99) for the server-side top 5 APIs at the application level, and support switching to trend charts
API monitor
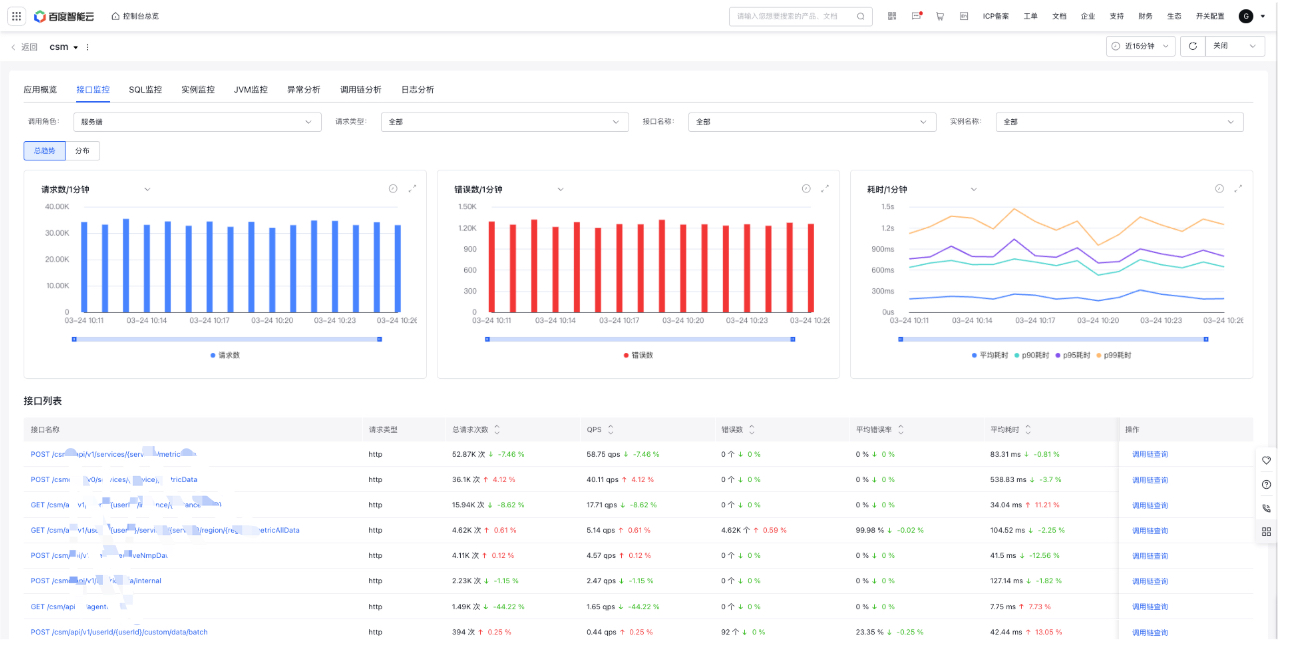
API monitor primarily views request metric data from the API level, helping users identify abnormal APIs
-
Filter criteria:
- Call role: Server (default), client, internal function, consumer and producer
- Request type: Support request types such as HTTP, gRPC, Redis, and MySQL, which vary with the calling role
- API: All by default, filterable for specific APIs
- Instance: All by default, filterable for specific instances
- Monitor trend chart: Display total request count, QPS, error count, average error rate, and latency trends, and support year-over-year and month-over-month comparisons, custom date comparisons; change according to filter criteria
-
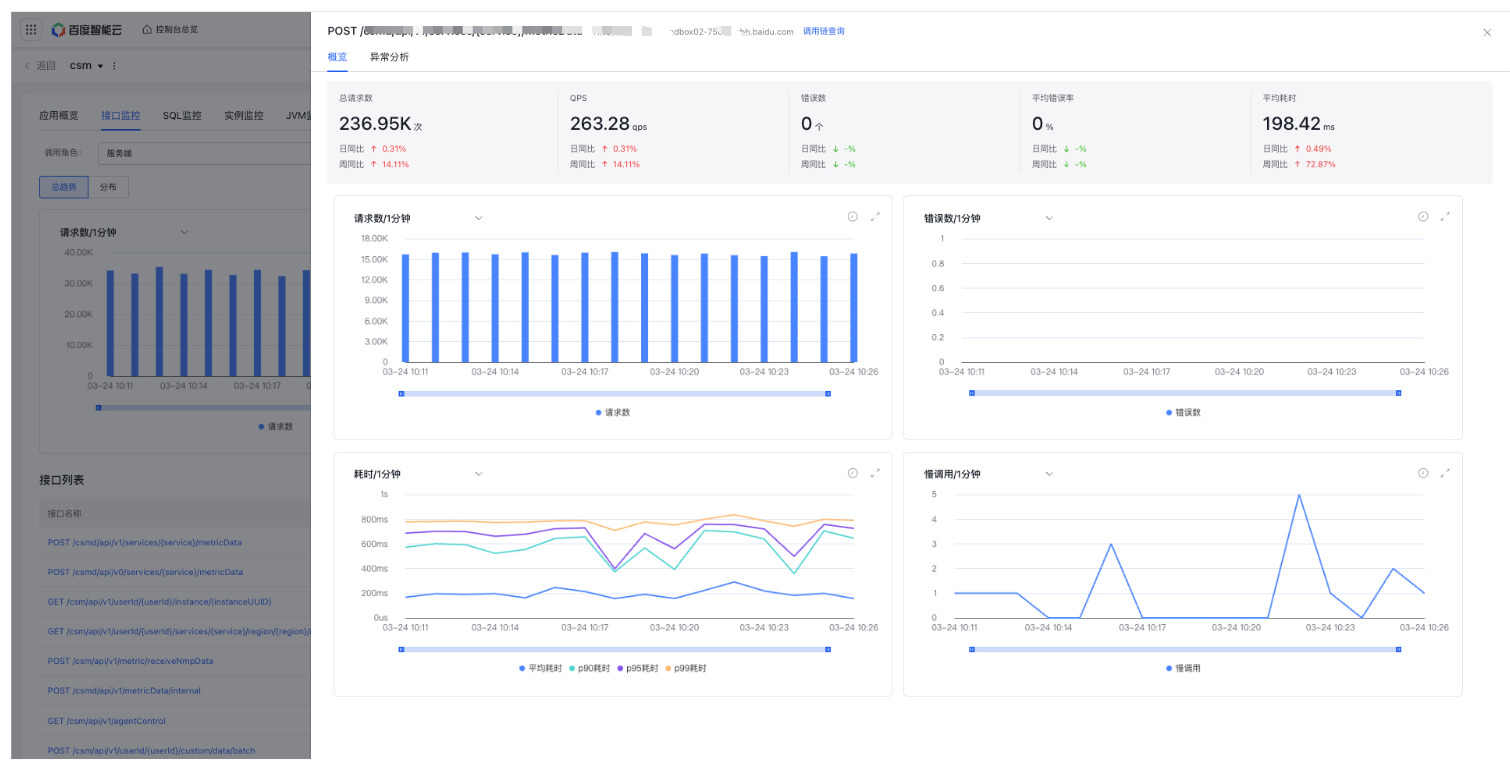
API list: Display a list of APIs and related request data
- Click an API to display API details, including overview data, metric trends, and exception data of that API
- Click Trace Explorer to redirect to the Trace Explorer tab with relevant API criteria pre-applied.
SQL monitor
SQL monitor analyzes request metrics from the SQL level, helping users identify abnormal or slow SQL
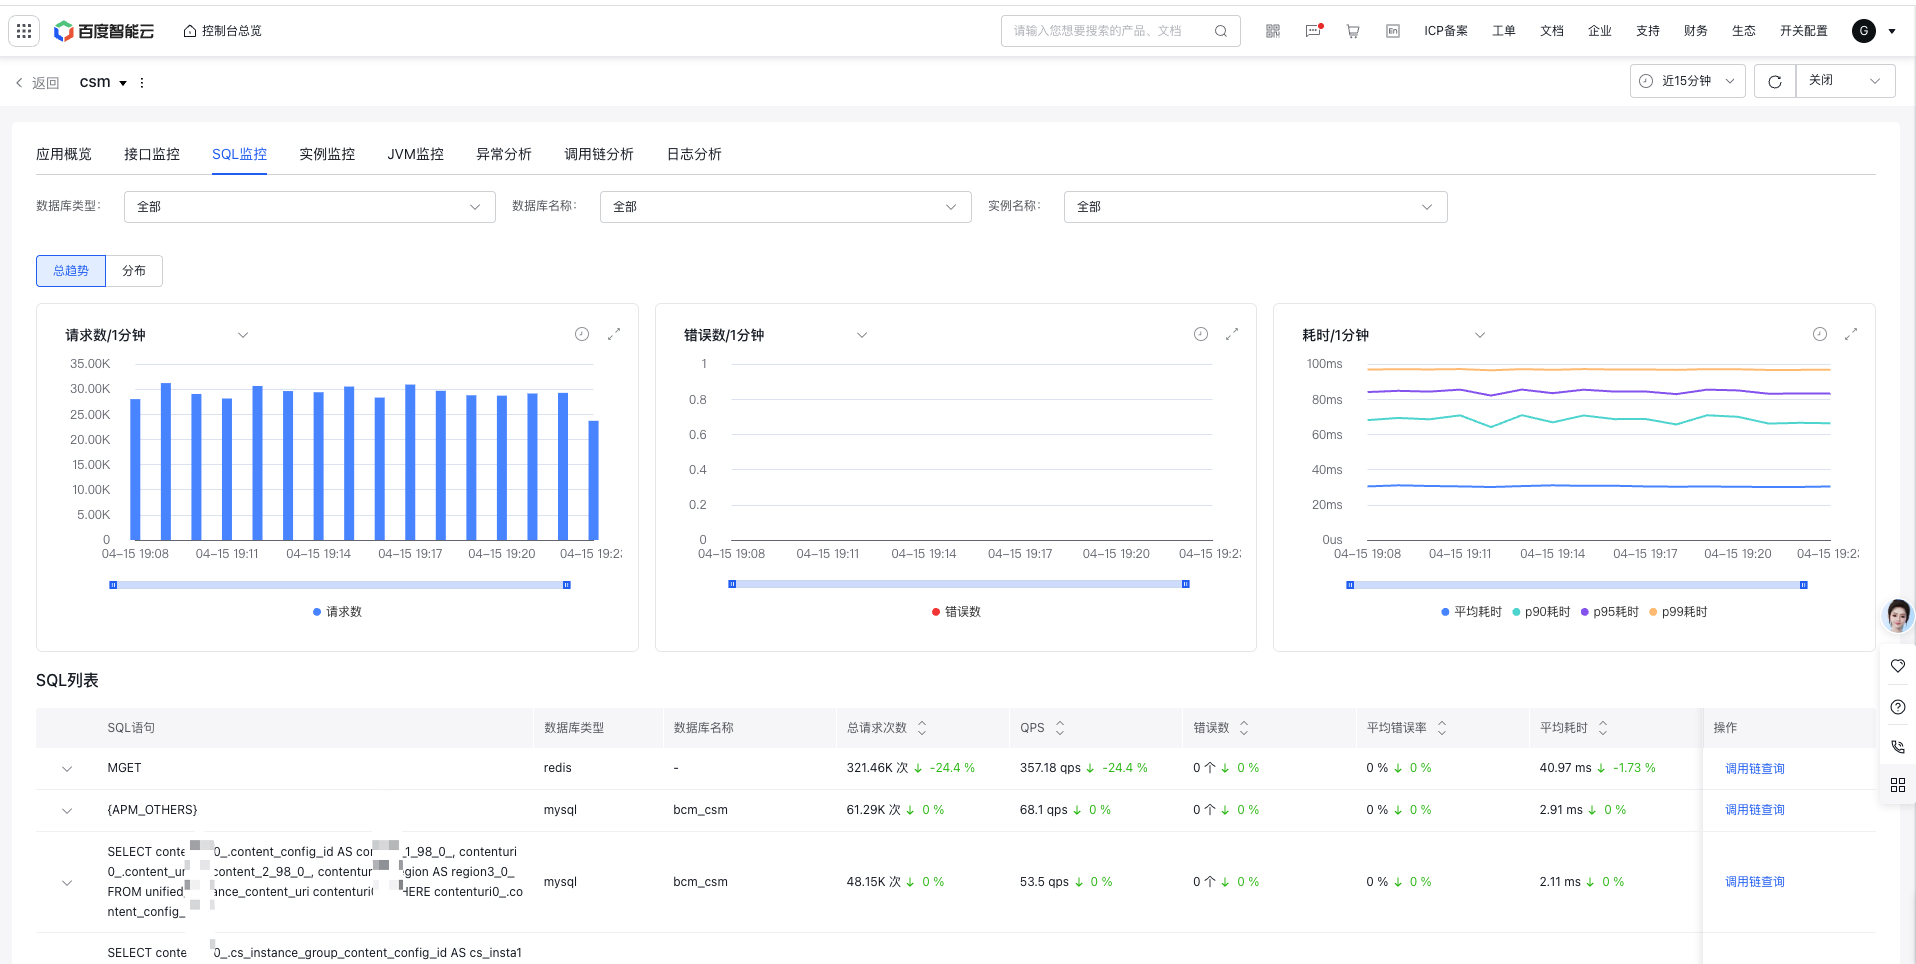
-
Filter criteria:
- Database type: All by default, mysql, redis, etc
- Database name: All by default, with the option to select a single database
- Instance Name: All by default, with the option to filter specific instances
- Monitor trend chart: Display total request count, QPS, error count, average error rate, and latency trends, and support year-over-year and month-over-month comparisons, custom date comparisons; change according to filter criteria
-
SQL list: Display a list of SQLs and related SQL request data
- Click on a single SQL to view the current SQL metric trend chart
- Click Trace Explorer to redirect to the Trace Explorer tab with relevant SQL criteria pre-applied.
Instance monitor
Instance monitor primarily views request metric data from the instance level, helping users identify abnormal instances.
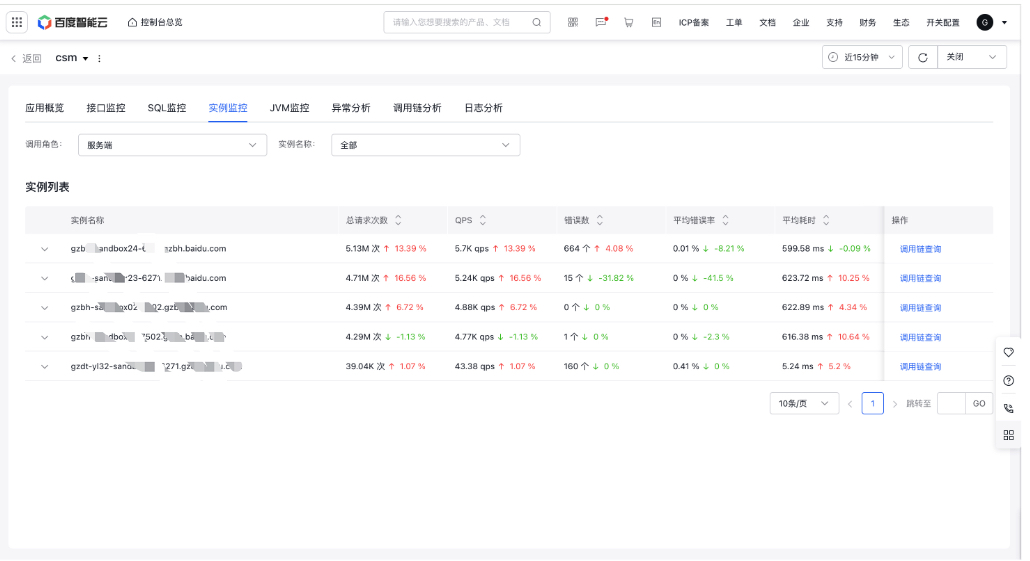
- Filter criteria: All instances by default. You can also search and select a single instance
-
Instance list: Display a list of instances and related request data,
- Click on an instance to view its metric trend chart
- Click Trace Explorer to redirect to the Trace Explorer tab with relevant instance criteria pre-applied.
JVM monitor
JVM Monitor tracks and analyzes Java Virtual Machine (JVM) runtime status, performance, and resource consumption in real-time or periodically. It helps developers assess application behavior, pinpoint performance bottlenecks (like memory leaks, frequent GC activity, or thread deadlocks), and fine-tune app performance and stability.
- Filter criteria: Select instance, all by default. You can also select a single instance
- Monitor trend: Display JVM-related metric data as follows:
- Metric description
| Category | Metrics | Description |
|---|---|---|
| Garbage collection (GC) | GC count | Record the count of Young-GC and Full-GC |
| Garbage collection (GC) | Average GC duration | Record the average duration of Young-GC and Full-GC |
| Garbage collection (GC) | Cumulative GC duration | Record the cumulative duration of Young-GC and Full-GC |
| CPU | CPU usage | Current CPU usage |
| CPU | CPU count | Count of CPU cores in the system |
| CPU | CPU time | CPU time details |
| Memory | Heap memory | Tracks heap memory usage, including used, max, and committed memory values. |
| Memory | Non-heap memory | Tracks non-heap memory usage, including used, max, and committed memory values. |
| Memory | Heap memory (used) | Provide detailed records of usage in the old generation space, young generation (Eden) space, and young generation (Survivor) space within heap memory. |
| Memory | Non-heap memory (used) | Provide detailed records of usage in the code cache area, metaspace, and compressed class space within non-heap memory. |
| Thread status | Thread status | Track the counts of different thread statuses, including blocked, daemon, deadlocked, new, runnable, terminated, timed_waiting, and waiting threads. |
| File | Class loading | Record the count of loaded and unloaded classes |
Exception analysis
Exception analysis displays all exception details of the application, helping users view exceptions and promptly locate issues

-
Filter criteria:
- Call role: All, server, client, internal function, consumer and producer
- Request type: Support request types such as HTTP, gRPC, Redis, and MySQL, which vary with the calling role
- API: All by default, filterable for specific APIs
- Instance: All by default, filterable for specific instances
- Exception trend chart: Display exception trends based on filter criteria
-
Exception list: Display a detailed list of exceptions, showing corresponding exceptions based on filter criteria
- Click on a single exception to view the current exception trend chart
- Click Trace Explorer to redirect to the tab with specific exception details
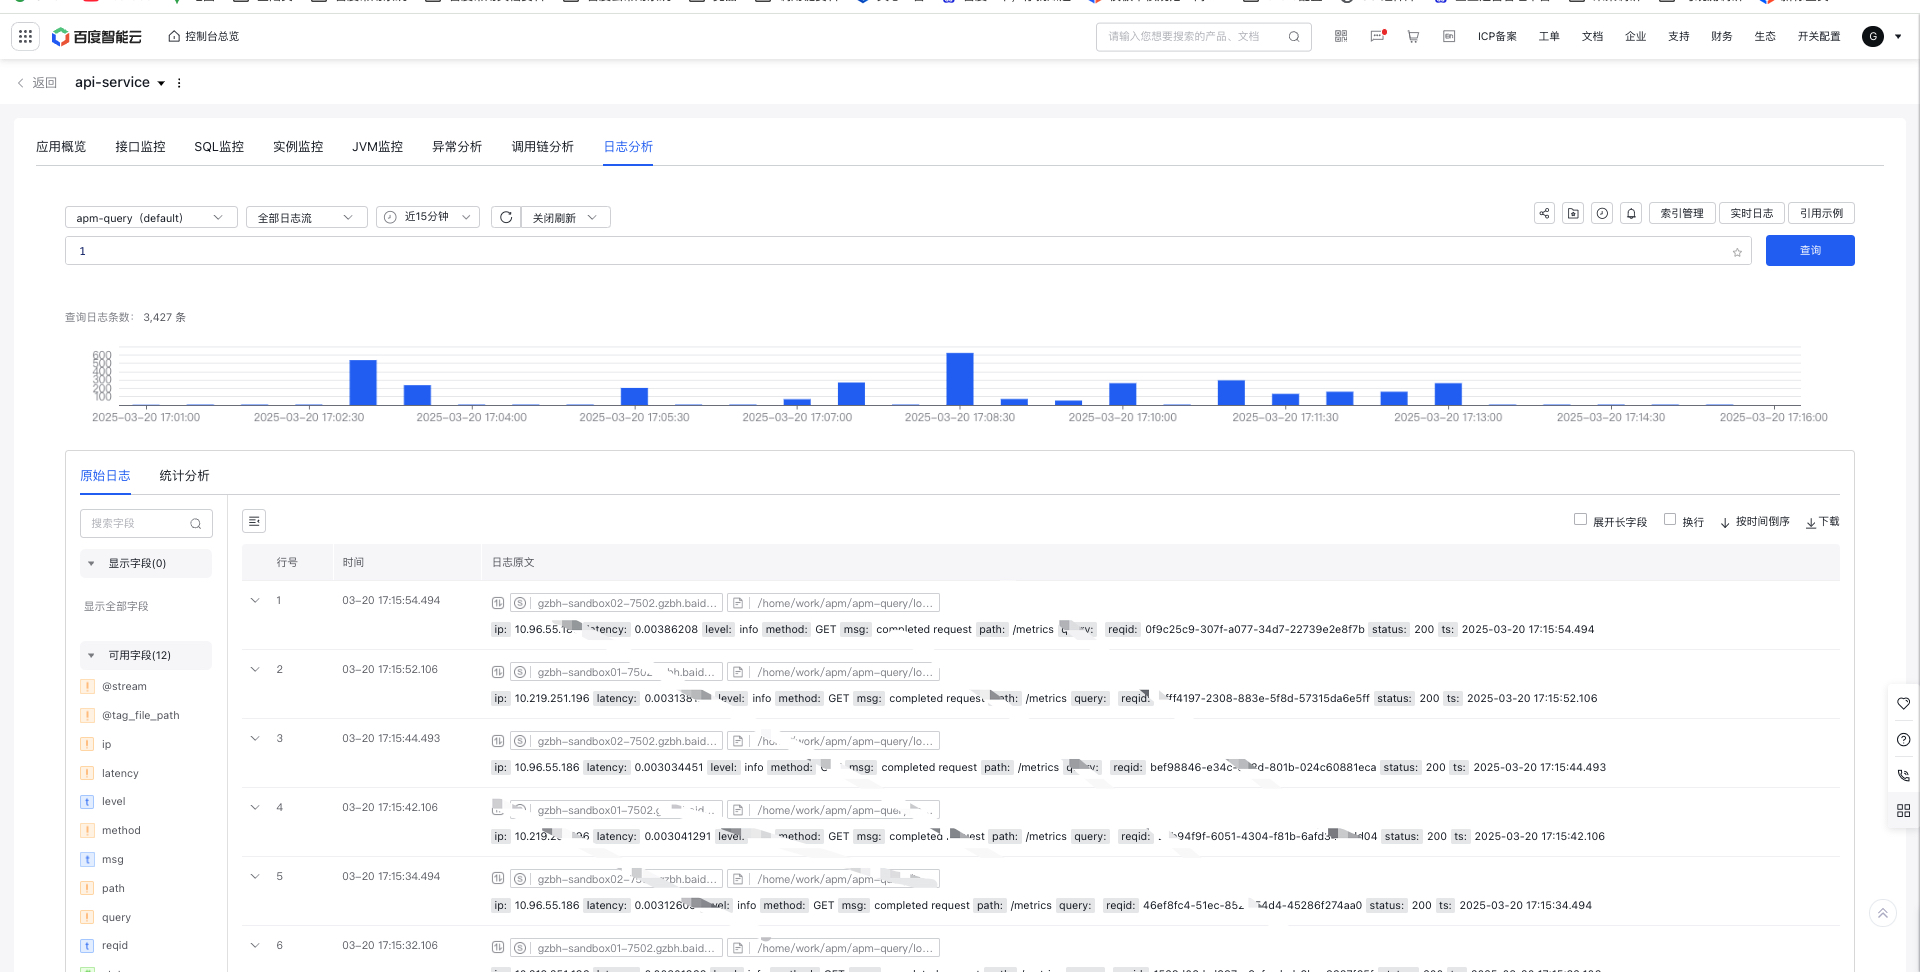
Log analysis
Application monitoring and logs are merged to enable unified supervision of metrics, chains, and logs. When viewing chain details, relevant log information can also be accessed, simplifying the troubleshooting process from chains to logs.
Step 1: Inject TraceID into logs
- To query both chains and logs, you need to inject TraceID into logs. For details, refer to Inject TraceID into Service Logs
Step 2: Associate the application with Baidu Log Service (BLS) in log service
- Please associate logs on the Application Configuration page, configure the association between the APM application and the BLS logstore, and customize the TraceId and SpanId fields, with the default being trace_id and span_id.

Step 3: View correlated service logs directly under Application Details -> Log Analysis
- In Application Details - Log Analysis page, directly view associated service logs, with custom log query supported
Step 4: Query the service logs corresponding to the traced call chains
- On Application Performance Monitor - Call Chain Analysis - Click a Single Trace Link Details - Right-side Span Details log tab, you can click on the log with the current Span's application, start time, end time, TraceId, and SpanId information (with the field names configured in step 2) to redirect to the Log Analysis page of the associated application (Note: The specific fields for TraceId and SpanId need to have indexes configured in advance for log retrieval)

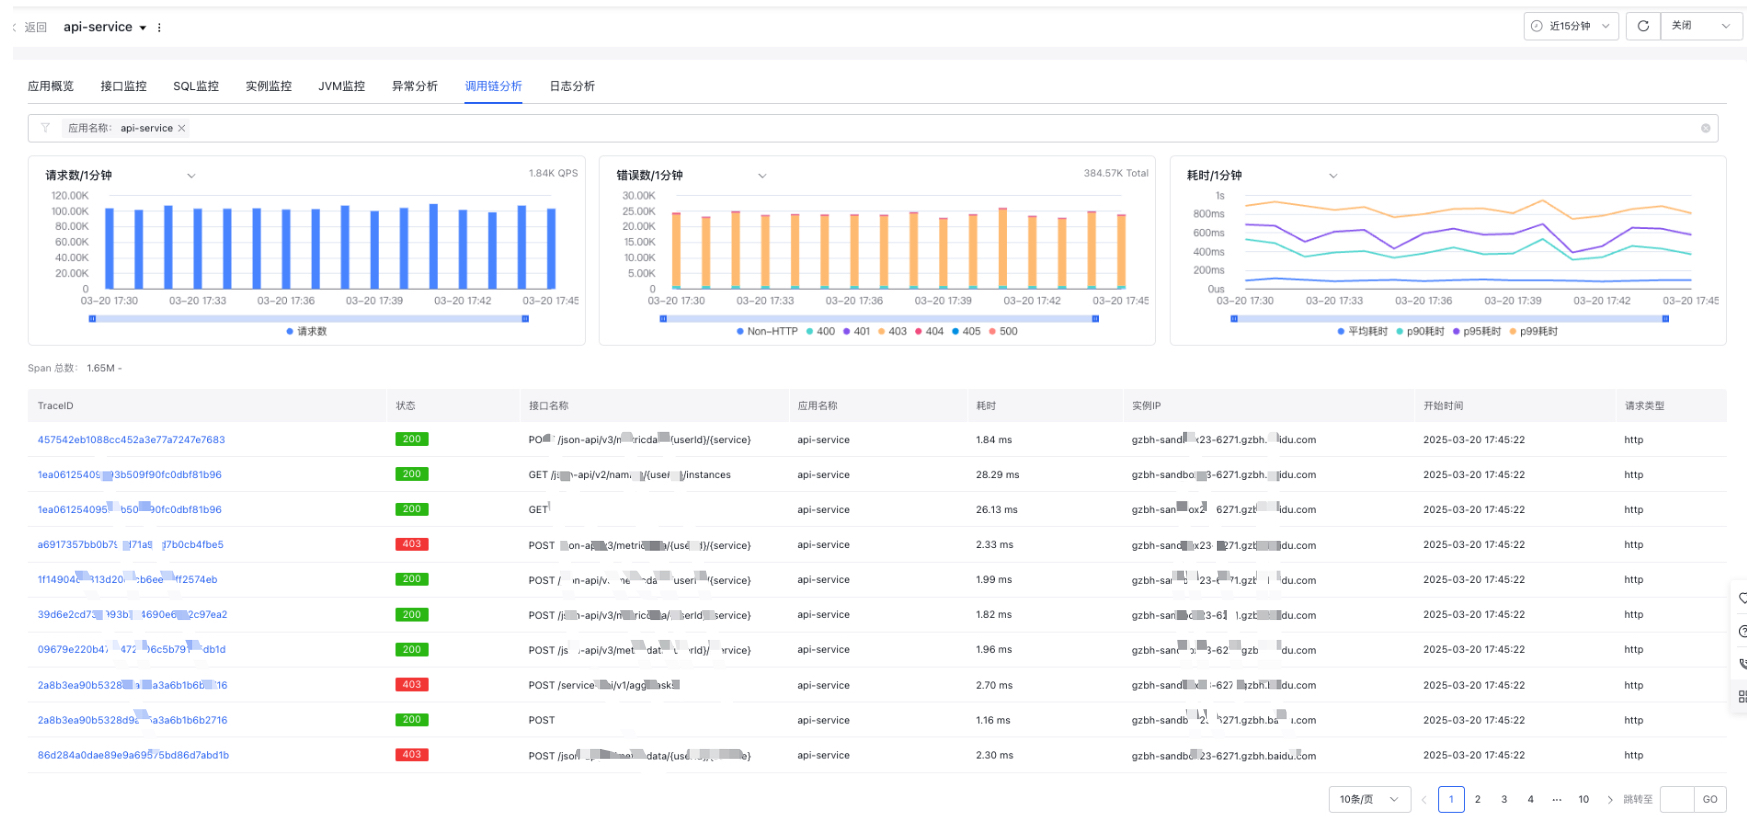
Call chain analysis
Display the call chain analysis of the current application, and allow custom queries of traced call chain of the application