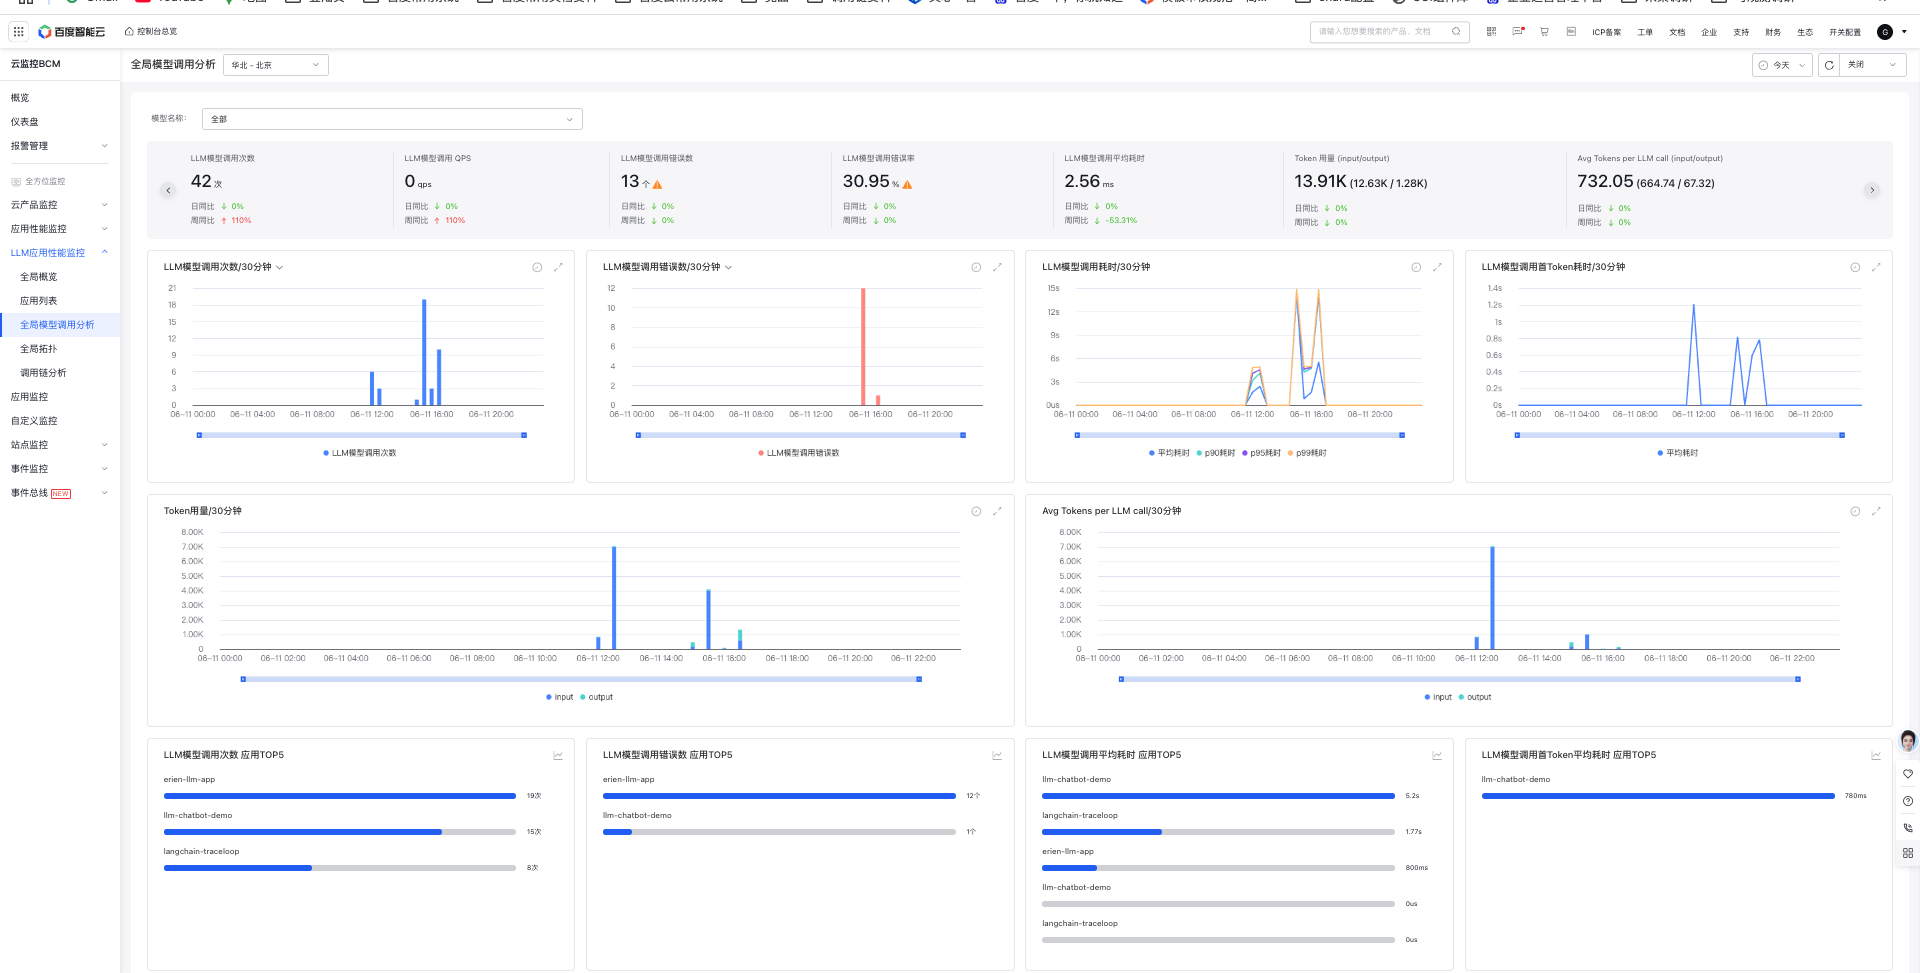
Global model call analysis provides a comprehensive view of all model call related data, and supports model switching to view model-specific data.
Overview data:
Panel
Description
LLM call count
Display the count of large model calls across all applications during the specified time period
LLM call QPS
Display the QPS of large model calls across all applications during the specified time period
LLM call error count
Display the count of large model call errors across all applications during the specified time period
LLM call error rate
Display the large model call error rate across all applications during the specified time period
Token usage
Display the token usage across all applications during the specified time period, with options to view input and output
Avg Tokens per LLM call
Display the average token usage per large model call across all applications during the specified time period, with options to view input and output
Model call trend data:
Panel
Description
Trend Chart of LLM Call Count
Display the LLM call count trend chart for all applications by default Support switching LLM call QPS Support switching Avg LLM call per request, which represents the average large model call count per user request
Trend Chart of LLM Call Error Count
Display the trend chart of LLM Call Error Count Across All Applications by default, supporting switching to the Trend Chart of LLM Call Error Rate
Trend Chart of LLM Call Latency
Display the latency trend chart for all applications calling LLM, supporting Avg, p90, p95, and p99 latency
Trend Chart of LLM Call First-token Latency
Display the trend chart for the LLM call time-to-first-token across all applications, supporting Avg, p90, p95, and p99 latency
Token Data Trend Chart:
Panel
Description
Token Usage Trend
Display the token usage trend across all applications during the specified time period, with options to view input and output
Trend of Average Tokens per LLM Call
Display the average token trend per large model call across all applications during the specified time period
Top 5 application rankings:
Panel
Description
Top 5 applications by LLM call count
Based on all application calls to large models, statistics show the Top 5 applications in terms of the large model call count, with support for switching trend chart display
Top 5 applications by LLM call errors
Based on all application calls to large models, statistics show the Top 5 applications in terms of the large model call error, with support for switching trend chart display
Top 5 applications by average LLM call latency
Based on all application calls to large models, statistics show the Top 5 applications in terms of the large model call average latency, with support for switching trend chart display
Top 5 applications by average LLM call time-to-first-token latency
Based on all application calls to large models, statistics show the Top 5 applications in terms of the large models to call the average first token latency, with support for switching trend chart display