4核8GB512GB计算型的3个数据节点实例基准性能测试
更新时间:2024-06-05
4核8GB 512GB计算型的3个数据节点实例基准性能测试
使用ESRally工具对数据节点规格为4核8GB的BES集群实例(7.10.2版本)进行基准测试。
压测配置
| 项目 | 说明 |
|---|---|
| 实例配置 | 版本:BES集群实例(7.10.2版本) 数据节点规格:4核8GB计算型 数据节点存储性能级别:增强型SSD_PL1 数据单节点存储空间:512GB 数据节点数量:3个 |
| ESRally配置 | 使用ESRally的默认配置tracks。 |
| 数据集 | 使用ESRally的预置数据集Geonames模拟测试场景,文档总数11396503。获取数据集,请查看ES Rally Hub获取。 |
| 分片数 | 主分片:6 副本数:0 |
| bulk_size | 每次批量操作提交5000个文档。 |
| bulk_indexing_clients | 同时执行批量索引操作的客户端数量为8个。 |
| index_append warmup time | 从默认的120s修改为30s,因为当集群配置高时,index_append在预热启动期间就完成了。 |
压测结果
压测结果仅供参考,无法代表实际生产中写入查询情况,建议您结合业务生产数据进行压测。
主要压测指标结果
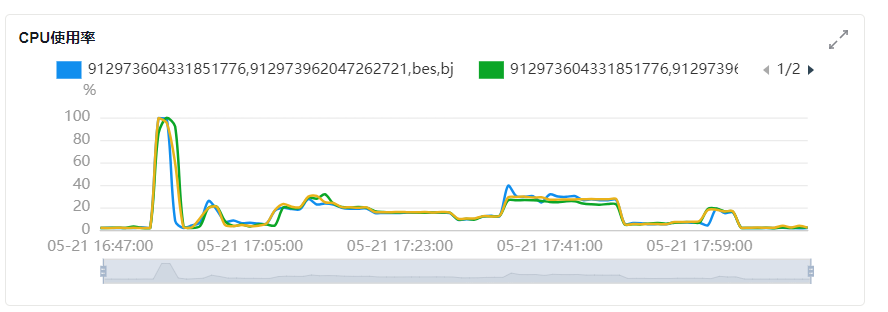
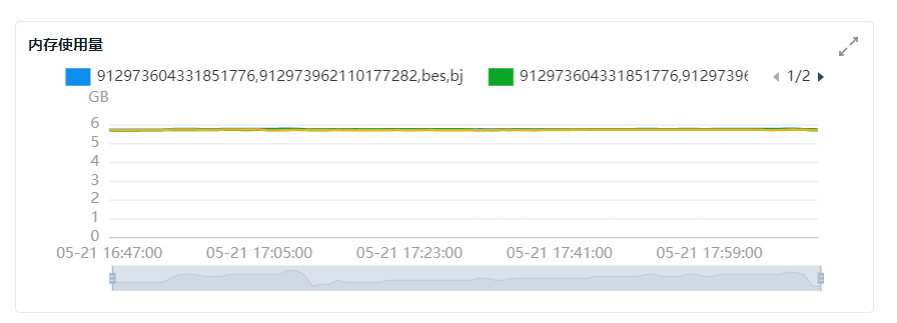
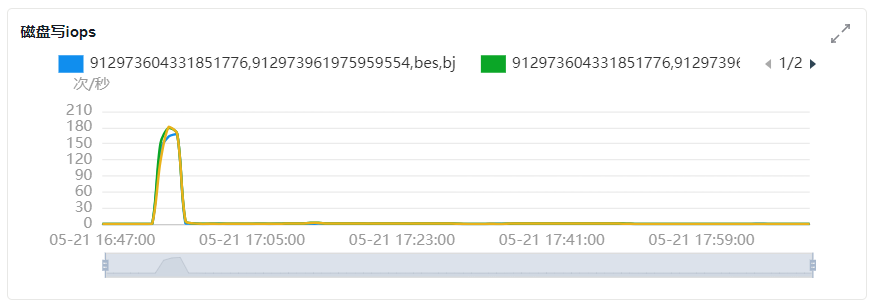
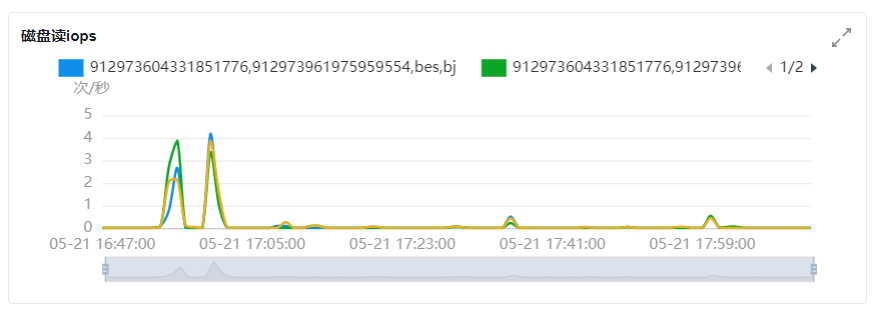
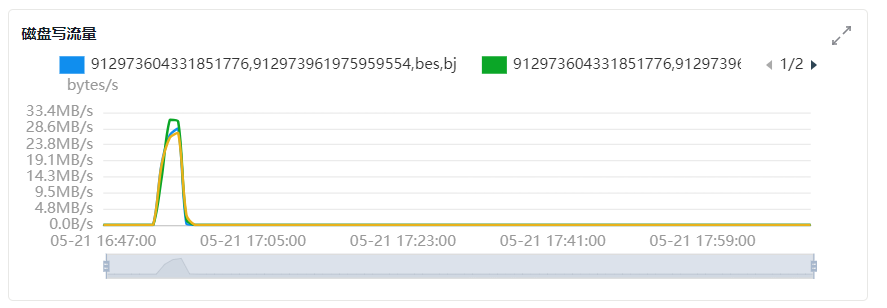
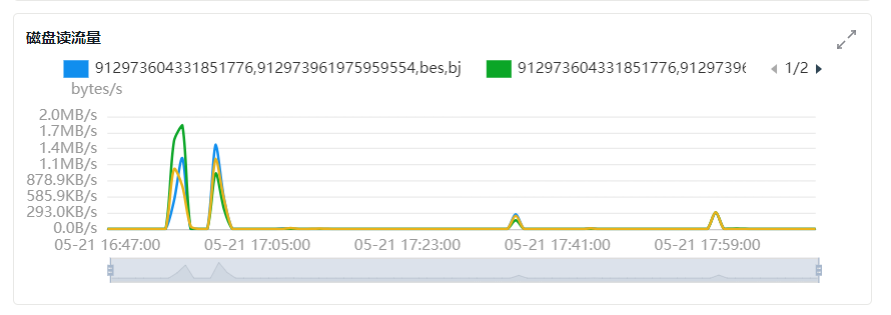
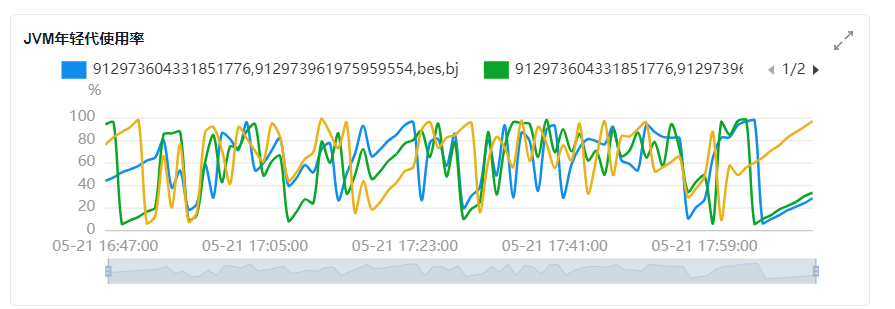
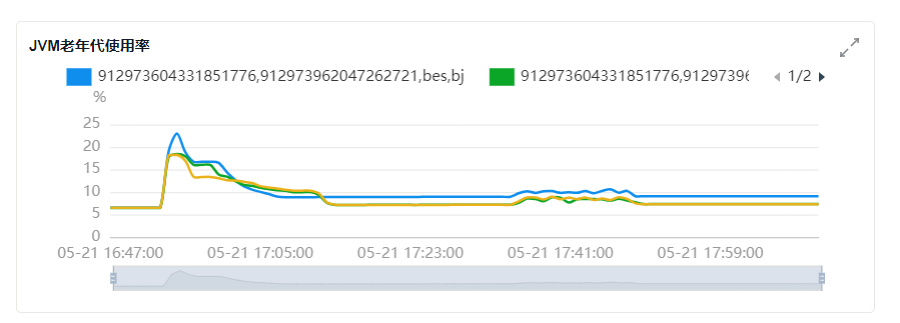
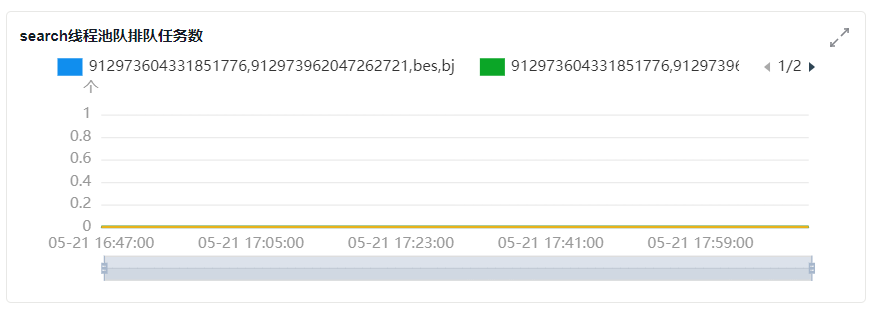
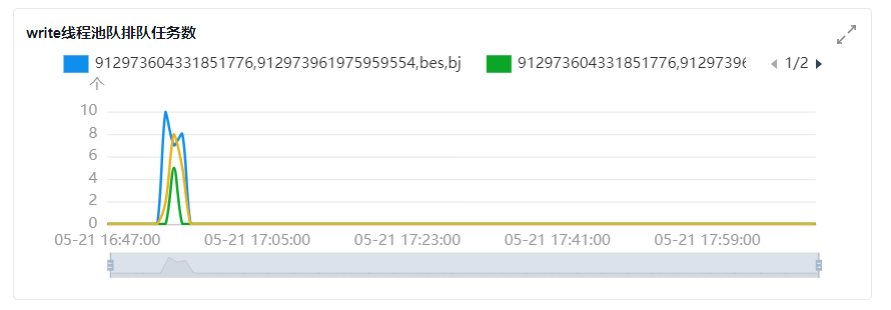
基准压测报告
| Metric | Task | Value | Unit |
|---|---|---|---|
| Cumulative indexing time of primary shards | 14.7237 | min | |
| Min cumulative indexing time across primary shards | 2.37027 | min | |
| Median cumulative indexing time across primary shards | 2.40307 | min | |
| Max cumulative indexing time across primary shards | 2.59477 | min | |
| Cumulative indexing throttle time of primary shards | 0 | min | |
| Min cumulative indexing throttle time across primary shards | 0 | min | |
| Median cumulative indexing throttle time across primary shards | 0 | min | |
| Max cumulative indexing throttle time across primary shards | 0 | min | |
| Cumulative merge time of primary shards | 5.38082 | min | |
| Cumulative merge count of primary shards | 25 | ||
| Min cumulative merge time across primary shards | 0.8093 | min | |
| Median cumulative merge time across primary shards | 0.894842 | min | |
| Max cumulative merge time across primary shards | 1.00987 | min | |
| Cumulative merge throttle time of primary shards | 1.0408 | min | |
| Min cumulative merge throttle time across primary shards | 0.1348 | min | |
| Median cumulative merge throttle time across primary shards | 0.159975 | min | |
| Max cumulative merge throttle time across primary shards | 0.22275 | min | |
| Cumulative refresh time of primary shards | 2.3357 | min | |
| Cumulative refresh count of primary shards | 148 | ||
| Min cumulative refresh time across primary shards | 0.35635 | min | |
| Median cumulative refresh time across primary shards | 0.3918 | min | |
| Max cumulative refresh time across primary shards | 0.42765 | min | |
| Cumulative flush time of primary shards | 0.210917 | min | |
| Cumulative flush count of primary shards | 12 | ||
| Min cumulative flush time across primary shards | 0.01755 | min | |
| Median cumulative flush time across primary shards | 0.0403667 | min | |
| Max cumulative flush time across primary shards | 0.0495 | min | |
| Total Young Gen GC time | 14.133 | s | |
| Total Young Gen GC count | 2901 | ||
| Total Old Gen GC time | 0 | s | |
| Total Old Gen GC count | 0 | ||
| Store size | 2.90995 | GB | |
| Translog size | 3.07336e-07 | GB | |
| Heap used for segments | 0.903454 | MB | |
| Heap used for doc values | 0.0789986 | MB | |
| Heap used for terms | 0.672699 | MB | |
| Heap used for norms | 0.0914307 | MB | |
| Heap used for points | 0 | MB | |
| Heap used for stored fields | 0.0603256 | MB | |
| Segment count | 119 | ||
| Total Ingest Pipeline count | 0 | ||
| Total Ingest Pipeline time | 0 | s | |
| Total Ingest Pipeline failed | 0 | ||
| Min Throughput | index-append | 85856.2 | docs/s |
| Mean Throughput | index-append | 86803.2 | docs/s |
| Median Throughput | index-append | 86893.6 | docs/s |
| Max Throughput | index-append | 87285.1 | docs/s |
| 50th percentile latency | index-append | 336.954 | ms |
| 90th percentile latency | index-append | 731.275 | ms |
| 99th percentile latency | index-append | 1587.01 | ms |
| 100th percentile latency | index-append | 2005.03 | ms |
| 50th percentile service time | index-append | 336.954 | ms |
| 90th percentile service time | index-append | 731.275 | ms |
| 99th percentile service time | index-append | 1587.01 | ms |
| 100th percentile service time | index-append | 2005.03 | ms |
| error rate | index-append | 0 | % |
| 100th percentile latency | refresh-after-index | 60210.2 | ms |
| 100th percentile service time | refresh-after-index | 60210.2 | ms |
| error rate | refresh-after-index | 100 | % |
| 100th percentile latency | refresh-after-force-merge | 60136.1 | ms |
| 100th percentile service time | refresh-after-force-merge | 60136.1 | ms |
| error rate | refresh-after-force-merge | 100 | % |
| Min Throughput | index-stats | 90.03 | ops/s |
| Mean Throughput | index-stats | 90.05 | ops/s |
| Median Throughput | index-stats | 90.05 | ops/s |
| Max Throughput | index-stats | 90.09 | ops/s |
| 50th percentile latency | index-stats | 2.88202 | ms |
| 90th percentile latency | index-stats | 3.78057 | ms |
| 99th percentile latency | index-stats | 4.43655 | ms |
| 99.9th percentile latency | index-stats | 10.1314 | ms |
| 100th percentile latency | index-stats | 12.89 | ms |
| 50th percentile service time | index-stats | 1.56157 | ms |
| 90th percentile service time | index-stats | 1.7524 | ms |
| 99th percentile service time | index-stats | 3.45842 | ms |
| 99.9th percentile service time | index-stats | 8.88811 | ms |
| 100th percentile service time | index-stats | 12.2731 | ms |
| error rate | index-stats | 0 | % |
| Min Throughput | node-stats | 90.03 | ops/s |
| Mean Throughput | node-stats | 90.07 | ops/s |
| Median Throughput | node-stats | 90.04 | ops/s |
| Max Throughput | node-stats | 90.17 | ops/s |
| 50th percentile latency | node-stats | 3.23138 | ms |
| 90th percentile latency | node-stats | 3.72642 | ms |
| 99th percentile latency | node-stats | 9.92562 | ms |
| 99.9th percentile latency | node-stats | 21.2769 | ms |
| 100th percentile latency | node-stats | 23.0148 | ms |
| 50th percentile service time | node-stats | 2.31196 | ms |
| 90th percentile service time | node-stats | 2.5836 | ms |
| 99th percentile service time | node-stats | 6.9647 | ms |
| 99.9th percentile service time | node-stats | 14.0312 | ms |
| 100th percentile service time | node-stats | 22.4266 | ms |
| error rate | node-stats | 0 | % |
| Min Throughput | default | 50.01 | ops/s |
| Mean Throughput | default | 50.02 | ops/s |
| Median Throughput | default | 50.02 | ops/s |
| Max Throughput | default | 50.04 | ops/s |
| 50th percentile latency | default | 3.27949 | ms |
| 90th percentile latency | default | 4.50475 | ms |
| 99th percentile latency | default | 9.26823 | ms |
| 99.9th percentile latency | default | 21.1412 | ms |
| 100th percentile latency | default | 22.0378 | ms |
| 50th percentile service time | default | 2.15493 | ms |
| 90th percentile service time | default | 2.49955 | ms |
| 99th percentile service time | default | 8.75379 | ms |
| 99.9th percentile service time | default | 20.1732 | ms |
| 100th percentile service time | default | 20.4612 | ms |
| error rate | default | 0 | % |
| Min Throughput | term | 99.23 | ops/s |
| Mean Throughput | term | 99.53 | ops/s |
| Median Throughput | term | 99.56 | ops/s |
| Max Throughput | term | 99.7 | ops/s |
| 50th percentile latency | term | 3.41989 | ms |
| 90th percentile latency | term | 3.8345 | ms |
| 99th percentile latency | term | 15.0295 | ms |
| 99.9th percentile latency | term | 34.5923 | ms |
| 100th percentile latency | term | 35.9145 | ms |
| 50th percentile service time | term | 2.33014 | ms |
| 90th percentile service time | term | 2.63693 | ms |
| 99th percentile service time | term | 6.76757 | ms |
| 99.9th percentile service time | term | 22.3215 | ms |
| 100th percentile service time | term | 22.4099 | ms |
| error rate | term | 0 | % |
| Min Throughput | phrase | 108.7 | ops/s |
| Mean Throughput | phrase | 109.21 | ops/s |
| Median Throughput | phrase | 109.28 | ops/s |
| Max Throughput | phrase | 109.5 | ops/s |
| 50th percentile latency | phrase | 3.12651 | ms |
| 90th percentile latency | phrase | 3.63205 | ms |
| 99th percentile latency | phrase | 18.2967 | ms |
| 99.9th percentile latency | phrase | 38.804 | ms |
| 100th percentile latency | phrase | 39.1649 | ms |
| 50th percentile service time | phrase | 2.19042 | ms |
| 90th percentile service time | phrase | 2.52546 | ms |
| 99th percentile service time | phrase | 8.3174 | ms |
| 99.9th percentile service time | phrase | 25.0611 | ms |
| 100th percentile service time | phrase | 26.6727 | ms |
| error rate | phrase | 0 | % |
| Min Throughput | country_agg_uncached | 3 | ops/s |
| Mean Throughput | country_agg_uncached | 3 | ops/s |
| Median Throughput | country_agg_uncached | 3 | ops/s |
| Max Throughput | country_agg_uncached | 3 | ops/s |
| 50th percentile latency | country_agg_uncached | 121.606 | ms |
| 90th percentile latency | country_agg_uncached | 129.095 | ms |
| 99th percentile latency | country_agg_uncached | 139.924 | ms |
| 100th percentile latency | country_agg_uncached | 194.642 | ms |
| 50th percentile service time | country_agg_uncached | 120.152 | ms |
| 90th percentile service time | country_agg_uncached | 127.552 | ms |
| 99th percentile service time | country_agg_uncached | 137.707 | ms |
| 100th percentile service time | country_agg_uncached | 192.181 | ms |
| error rate | country_agg_uncached | 0 | % |
| Min Throughput | country_agg_cached | 98.97 | ops/s |
| Mean Throughput | country_agg_cached | 99.24 | ops/s |
| Median Throughput | country_agg_cached | 99.27 | ops/s |
| Max Throughput | country_agg_cached | 99.43 | ops/s |
| 50th percentile latency | country_agg_cached | 2.71151 | ms |
| 90th percentile latency | country_agg_cached | 3.12794 | ms |
| 99th percentile latency | country_agg_cached | 6.00165 | ms |
| 99.9th percentile latency | country_agg_cached | 19.9261 | ms |
| 100th percentile latency | country_agg_cached | 24.7657 | ms |
| 50th percentile service time | country_agg_cached | 1.72649 | ms |
| 90th percentile service time | country_agg_cached | 2.00915 | ms |
| 99th percentile service time | country_agg_cached | 4.45331 | ms |
| 99.9th percentile service time | country_agg_cached | 14.909 | ms |
| 100th percentile service time | country_agg_cached | 15.2913 | ms |
| error rate | country_agg_cached | 0 | % |
| Min Throughput | scroll | 20.04 | pages/s |
| Mean Throughput | scroll | 20.05 | pages/s |
| Median Throughput | scroll | 20.05 | pages/s |
| Max Throughput | scroll | 20.07 | pages/s |
| 50th percentile latency | scroll | 247.022 | ms |
| 90th percentile latency | scroll | 254.168 | ms |
| 99th percentile latency | scroll | 270.668 | ms |
| 100th percentile latency | scroll | 271.919 | ms |
| 50th percentile service time | scroll | 244.647 | ms |
| 90th percentile service time | scroll | 252.39 | ms |
| 99th percentile service time | scroll | 268.858 | ms |
| 100th percentile service time | scroll | 269.417 | ms |
| error rate | scroll | 0 | % |
| Min Throughput | expression | 1.5 | ops/s |
| Mean Throughput | expression | 1.5 | ops/s |
| Median Throughput | expression | 1.5 | ops/s |
| Max Throughput | expression | 1.5 | ops/s |
| 50th percentile latency | expression | 227.772 | ms |
| 90th percentile latency | expression | 296.556 | ms |
| 99th percentile latency | expression | 379.993 | ms |
| 100th percentile latency | expression | 392.97 | ms |
| 50th percentile service time | expression | 226.091 | ms |
| 90th percentile service time | expression | 295.035 | ms |
| 99th percentile service time | expression | 378.228 | ms |
| 100th percentile service time | expression | 392.017 | ms |
| error rate | expression | 0 | % |
| Min Throughput | painless_static | 1.4 | ops/s |
| Mean Throughput | painless_static | 1.4 | ops/s |
| Median Throughput | painless_static | 1.4 | ops/s |
| Max Throughput | painless_static | 1.4 | ops/s |
| 50th percentile latency | painless_static | 318.866 | ms |
| 90th percentile latency | painless_static | 381.073 | ms |
| 99th percentile latency | painless_static | 436.901 | ms |
| 100th percentile latency | painless_static | 497.268 | ms |
| 50th percentile service time | painless_static | 317.356 | ms |
| 90th percentile service time | painless_static | 379.478 | ms |
| 99th percentile service time | painless_static | 434.922 | ms |
| 100th percentile service time | painless_static | 495.764 | ms |
| error rate | painless_static | 0 | % |
| Min Throughput | painless_dynamic | 1.4 | ops/s |
| Mean Throughput | painless_dynamic | 1.4 | ops/s |
| Median Throughput | painless_dynamic | 1.4 | ops/s |
| Max Throughput | painless_dynamic | 1.4 | ops/s |
| 50th percentile latency | painless_dynamic | 261.219 | ms |
| 90th percentile latency | painless_dynamic | 271.269 | ms |
| 99th percentile latency | painless_dynamic | 283.209 | ms |
| 100th percentile latency | painless_dynamic | 284.818 | ms |
| 50th percentile service time | painless_dynamic | 259.705 | ms |
| 90th percentile service time | painless_dynamic | 269.99 | ms |
| 99th percentile service time | painless_dynamic | 281.275 | ms |
| 100th percentile service time | painless_dynamic | 283.636 | ms |
| error rate | painless_dynamic | 0 | % |
| Min Throughput | decay_geo_gauss_function_score | 1 | ops/s |
| Mean Throughput | decay_geo_gauss_function_score | 1 | ops/s |
| Median Throughput | decay_geo_gauss_function_score | 1 | ops/s |
| Max Throughput | decay_geo_gauss_function_score | 1 | ops/s |
| 50th percentile latency | decay_geo_gauss_function_score | 284.092 | ms |
| 90th percentile latency | decay_geo_gauss_function_score | 306.231 | ms |
| 99th percentile latency | decay_geo_gauss_function_score | 327.07 | ms |
| 100th percentile latency | decay_geo_gauss_function_score | 334.476 | ms |
| 50th percentile service time | decay_geo_gauss_function_score | 282.229 | ms |
| 90th percentile service time | decay_geo_gauss_function_score | 304.133 | ms |
| 99th percentile service time | decay_geo_gauss_function_score | 325.286 | ms |
| 100th percentile service time | decay_geo_gauss_function_score | 332.144 | ms |
| error rate | decay_geo_gauss_function_score | 0 | % |
| Min Throughput | decay_geo_gauss_script_score | 1 | ops/s |
| Mean Throughput | decay_geo_gauss_script_score | 1 | ops/s |
| Median Throughput | decay_geo_gauss_script_score | 1 | ops/s |
| Max Throughput | decay_geo_gauss_script_score | 1 | ops/s |
| 50th percentile latency | decay_geo_gauss_script_score | 278.615 | ms |
| 90th percentile latency | decay_geo_gauss_script_score | 284.208 | ms |
| 99th percentile latency | decay_geo_gauss_script_score | 294.642 | ms |
| 100th percentile latency | decay_geo_gauss_script_score | 298.638 | ms |
| 50th percentile service time | decay_geo_gauss_script_score | 276.775 | ms |
| 90th percentile service time | decay_geo_gauss_script_score | 282.695 | ms |
| 99th percentile service time | decay_geo_gauss_script_score | 292.659 | ms |
| 100th percentile service time | decay_geo_gauss_script_score | 296.431 | ms |
| error rate | decay_geo_gauss_script_score | 0 | % |
| Min Throughput | field_value_function_score | 1.5 | ops/s |
| Mean Throughput | field_value_function_score | 1.51 | ops/s |
| Median Throughput | field_value_function_score | 1.5 | ops/s |
| Max Throughput | field_value_function_score | 1.51 | ops/s |
| 50th percentile latency | field_value_function_score | 104.891 | ms |
| 90th percentile latency | field_value_function_score | 118.247 | ms |
| 99th percentile latency | field_value_function_score | 156.556 | ms |
| 100th percentile latency | field_value_function_score | 173.81 | ms |
| 50th percentile service time | field_value_function_score | 103.3 | ms |
| 90th percentile service time | field_value_function_score | 116.564 | ms |
| 99th percentile service time | field_value_function_score | 154.567 | ms |
| 100th percentile service time | field_value_function_score | 171.585 | ms |
| error rate | field_value_function_score | 0 | % |
| Min Throughput | field_value_script_score | 1.5 | ops/s |
| Mean Throughput | field_value_script_score | 1.5 | ops/s |
| Median Throughput | field_value_script_score | 1.5 | ops/s |
| Max Throughput | field_value_script_score | 1.51 | ops/s |
| 50th percentile latency | field_value_script_score | 131.701 | ms |
| 90th percentile latency | field_value_script_score | 147.025 | ms |
| 99th percentile latency | field_value_script_score | 209.773 | ms |
| 100th percentile latency | field_value_script_score | 218.408 | ms |
| 50th percentile service time | field_value_script_score | 129.87 | ms |
| 90th percentile service time | field_value_script_score | 146.026 | ms |
| 99th percentile service time | field_value_script_score | 208.177 | ms |
| 100th percentile service time | field_value_script_score | 216.713 | ms |
| error rate | field_value_script_score | 0 | % |
| Min Throughput | large_terms | 1.1 | ops/s |
| Mean Throughput | large_terms | 1.1 | ops/s |
| Median Throughput | large_terms | 1.1 | ops/s |
| Max Throughput | large_terms | 1.1 | ops/s |
| 50th percentile latency | large_terms | 549.582 | ms |
| 90th percentile latency | large_terms | 564.981 | ms |
| 99th percentile latency | large_terms | 625.616 | ms |
| 100th percentile latency | large_terms | 629.699 | ms |
| 50th percentile service time | large_terms | 542.805 | ms |
| 90th percentile service time | large_terms | 558.597 | ms |
| 99th percentile service time | large_terms | 618.715 | ms |
| 100th percentile service time | large_terms | 622.72 | ms |
| error rate | large_terms | 0 | % |
| Min Throughput | large_filtered_terms | 1.1 | ops/s |
| Mean Throughput | large_filtered_terms | 1.1 | ops/s |
| Median Throughput | large_filtered_terms | 1.1 | ops/s |
| Max Throughput | large_filtered_terms | 1.1 | ops/s |
| 50th percentile latency | large_filtered_terms | 537.876 | ms |
| 90th percentile latency | large_filtered_terms | 562.391 | ms |
| 99th percentile latency | large_filtered_terms | 604.459 | ms |
| 100th percentile latency | large_filtered_terms | 605.975 | ms |
| 50th percentile service time | large_filtered_terms | 531.211 | ms |
| 90th percentile service time | large_filtered_terms | 556.294 | ms |
| 99th percentile service time | large_filtered_terms | 597.845 | ms |
| 100th percentile service time | large_filtered_terms | 599.668 | ms |
| error rate | large_filtered_terms | 0 | % |
| Min Throughput | large_prohibited_terms | 1.1 | ops/s |
| Mean Throughput | large_prohibited_terms | 1.1 | ops/s |
| Median Throughput | large_prohibited_terms | 1.1 | ops/s |
| Max Throughput | large_prohibited_terms | 1.1 | ops/s |
| 50th percentile latency | large_prohibited_terms | 534.651 | ms |
| 90th percentile latency | large_prohibited_terms | 564.35 | ms |
| 99th percentile latency | large_prohibited_terms | 581.457 | ms |
| 100th percentile latency | large_prohibited_terms | 586.575 | ms |
| 50th percentile service time | large_prohibited_terms | 528.209 | ms |
| 90th percentile service time | large_prohibited_terms | 557.814 | ms |
| 99th percentile service time | large_prohibited_terms | 574.667 | ms |
| 100th percentile service time | large_prohibited_terms | 580.075 | ms |
| error rate | large_prohibited_terms | 0 | % |
| Min Throughput | desc_sort_population | 1.5 | ops/s |
| Mean Throughput | desc_sort_population | 1.5 | ops/s |
| Median Throughput | desc_sort_population | 1.5 | ops/s |
| Max Throughput | desc_sort_population | 1.51 | ops/s |
| 50th percentile latency | desc_sort_population | 50.7253 | ms |
| 90th percentile latency | desc_sort_population | 57.6335 | ms |
| 99th percentile latency | desc_sort_population | 75.6575 | ms |
| 100th percentile latency | desc_sort_population | 77.1718 | ms |
| 50th percentile service time | desc_sort_population | 49.0796 | ms |
| 90th percentile service time | desc_sort_population | 55.4331 | ms |
| 99th percentile service time | desc_sort_population | 73.7205 | ms |
| 100th percentile service time | desc_sort_population | 76.3047 | ms |
| error rate | desc_sort_population | 0 | % |
| Min Throughput | asc_sort_population | 1.5 | ops/s |
| Mean Throughput | asc_sort_population | 1.51 | ops/s |
| Median Throughput | asc_sort_population | 1.51 | ops/s |
| Max Throughput | asc_sort_population | 1.51 | ops/s |
| 50th percentile latency | asc_sort_population | 51.1803 | ms |
| 90th percentile latency | asc_sort_population | 64.4503 | ms |
| 99th percentile latency | asc_sort_population | 94.2661 | ms |
| 100th percentile latency | asc_sort_population | 102.594 | ms |
| 50th percentile service time | asc_sort_population | 49.4391 | ms |
| 90th percentile service time | asc_sort_population | 61.6553 | ms |
| 99th percentile service time | asc_sort_population | 92.323 | ms |
| 100th percentile service time | asc_sort_population | 100.32 | ms |
| error rate | asc_sort_population | 0 | % |
| Min Throughput | asc_sort_with_after_population | 1.5 | ops/s |
| Mean Throughput | asc_sort_with_after_population | 1.5 | ops/s |
| Median Throughput | asc_sort_with_after_population | 1.5 | ops/s |
| Max Throughput | asc_sort_with_after_population | 1.51 | ops/s |
| 50th percentile latency | asc_sort_with_after_population | 72.0933 | ms |
| 90th percentile latency | asc_sort_with_after_population | 76.2541 | ms |
| 99th percentile latency | asc_sort_with_after_population | 78.9059 | ms |
| 100th percentile latency | asc_sort_with_after_population | 79.0101 | ms |
| 50th percentile service time | asc_sort_with_after_population | 70.6371 | ms |
| 90th percentile service time | asc_sort_with_after_population | 74.2892 | ms |
| 99th percentile service time | asc_sort_with_after_population | 77.1596 | ms |
| 100th percentile service time | asc_sort_with_after_population | 77.2173 | ms |
| error rate | asc_sort_with_after_population | 0 | % |
| Min Throughput | desc_sort_geonameid | 6.01 | ops/s |
| Mean Throughput | desc_sort_geonameid | 6.01 | ops/s |
| Median Throughput | desc_sort_geonameid | 6.01 | ops/s |
| Max Throughput | desc_sort_geonameid | 6.02 | ops/s |
| 50th percentile latency | desc_sort_geonameid | 6.53949 | ms |
| 90th percentile latency | desc_sort_geonameid | 7.71243 | ms |
| 99th percentile latency | desc_sort_geonameid | 13.2451 | ms |
| 100th percentile latency | desc_sort_geonameid | 14.567 | ms |
| 50th percentile service time | desc_sort_geonameid | 5.3374 | ms |
| 90th percentile service time | desc_sort_geonameid | 6.38921 | ms |
| 99th percentile service time | desc_sort_geonameid | 11.6389 | ms |
| 100th percentile service time | desc_sort_geonameid | 13.5502 | ms |
| error rate | desc_sort_geonameid | 0 | % |
| Min Throughput | desc_sort_with_after_geonameid | 6.01 | ops/s |
| Mean Throughput | desc_sort_with_after_geonameid | 6.01 | ops/s |
| Median Throughput | desc_sort_with_after_geonameid | 6.01 | ops/s |
| Max Throughput | desc_sort_with_after_geonameid | 6.01 | ops/s |
| 50th percentile latency | desc_sort_with_after_geonameid | 61.855 | ms |
| 90th percentile latency | desc_sort_with_after_geonameid | 69.3716 | ms |
| 99th percentile latency | desc_sort_with_after_geonameid | 118.555 | ms |
| 100th percentile latency | desc_sort_with_after_geonameid | 119.929 | ms |
| 50th percentile service time | desc_sort_with_after_geonameid | 60.9539 | ms |
| 90th percentile service time | desc_sort_with_after_geonameid | 67.9422 | ms |
| 99th percentile service time | desc_sort_with_after_geonameid | 117.344 | ms |
| 100th percentile service time | desc_sort_with_after_geonameid | 118.567 | ms |
| error rate | desc_sort_with_after_geonameid | 0 | % |
| Min Throughput | asc_sort_geonameid | 6.02 | ops/s |
| Mean Throughput | asc_sort_geonameid | 6.02 | ops/s |
| Median Throughput | asc_sort_geonameid | 6.02 | ops/s |
| Max Throughput | asc_sort_geonameid | 6.03 | ops/s |
| 50th percentile latency | asc_sort_geonameid | 6.87588 | ms |
| 90th percentile latency | asc_sort_geonameid | 8.01471 | ms |
| 99th percentile latency | asc_sort_geonameid | 9.60322 | ms |
| 100th percentile latency | asc_sort_geonameid | 13.9739 | ms |
| 50th percentile service time | asc_sort_geonameid | 5.55821 | ms |
| 90th percentile service time | asc_sort_geonameid | 6.42167 | ms |
| 99th percentile service time | asc_sort_geonameid | 8.50887 | ms |
| 100th percentile service time | asc_sort_geonameid | 12.8557 | ms |
| error rate | asc_sort_geonameid | 0 | % |
| Min Throughput | asc_sort_with_after_geonameid | 6.01 | ops/s |
| Mean Throughput | asc_sort_with_after_geonameid | 6.02 | ops/s |
| Median Throughput | asc_sort_with_after_geonameid | 6.02 | ops/s |
| Max Throughput | asc_sort_with_after_geonameid | 6.02 | ops/s |
| 50th percentile latency | asc_sort_with_after_geonameid | 54.6682 | ms |
| 90th percentile latency | asc_sort_with_after_geonameid | 61.0326 | ms |
| 99th percentile latency | asc_sort_with_after_geonameid | 85.6821 | ms |
| 100th percentile latency | asc_sort_with_after_geonameid | 110.872 | ms |
| 50th percentile service time | asc_sort_with_after_geonameid | 53.7899 | ms |
| 90th percentile service time | asc_sort_with_after_geonameid | 60.0184 | ms |
| 99th percentile service time | asc_sort_with_after_geonameid | 84.6155 | ms |
| 100th percentile service time | asc_sort_with_after_geonameid | 110.034 | ms |
| error rate | asc_sort_with_after_geonameid | 0 | % |
评价此篇文章
