
BLS Integration with Kibana
Steps of integrating BLS with Kibana
Operating principle
Kibana, Proxy and Elasticsearch need to be deployed in the client environment.
- Kibana: Used for querying, analyzing and visualizing data.
- Elasticsearch: Used to store Kibana meta data (mainly including very little configuration information, deployable on lower-configuration machines). Kibana meta information needs to be updated frequently, but BLS does not support update operations. Therefore, an Elasticsearch needs to be deployed specifically for storing Kibana meta data.
- Proxy: Used to distinguish Kibana's API requests compatible with meta data and log service Elasticsearch. A Proxy needs to be deployed to route Kibana's API requests.

1. Install Kibana
Currently, Helm and Docker are provided for deployment and installation in the client environment.
1.1 Helm deployment
1.1.1 Prerequisites
Ensure the following components are available in the cloud container service Kubernetes cluster:
- csi-provisioner (e.g., CCE CSI CDS Plugin, CCE CSI BOS Plugin, etc.)
- CoreDNS
- Nginx Ingress Controller (e.g., CCE Ingress Nginx Controller)
1.1.2 Operation steps
(1) Create a namespace (Namespace)
# Create a namespace
kubectl create namespace bls-kibana
(2) Create and edit the values.yaml file with the following content. Modify according to actual conditions. For BLS regional service addresses, see Service Domain
kibana:
  ingress:
      # Determine this value by searching ingress under CCE Cluster - O&M Management - Component Management and viewing the installed ingress console
      # Nginx Ingress Controller is set to nginx, currently only supporting nginx type
      className: "nginx"
      # Null is allowed. If Kibana needs to be accessed via a domain name, this value can be set
      domain: ""
elasticsearch:
  # Please modify the ES password according to actual conditions. It is also the password of elastic corresponding to Kibana's account
  password: "changeme"
  data:
    # Cloud provider, supporting Baidu. If it is null, data will not be persisted, causing data loss after Elasticsearch restarts
    cloudVendor: baidu
bls:
  # Baidu AI Cloud account access key
  ak: ***********************
  # Baidu AI Cloud account access key
  sk: ***********************
  # Baidu AI Cloud account ID
  userid: ***********************
  # BLS address
  endpoint: http://bls-log.yq.baidubce.com
(3) Execute the following commands for deployment with Helm
#  Download the bls-kibana chart package
wget -O bls-kibana-1.0.0.tgz https://helm-online.bj.bcebos.com/bls-kibana/bls-kibana-1.0.0.tgz
# Deploy bls-kibana
helm install bls-kibana bls-kibana-1.0.0.tgz -f values.yaml --namespace bls-kibana
(4) After deployment, enter http://${ingress address} in the browser, where the ingress address can be viewed via the command line or CCE page


Access the Kibana page
1.2 Docker deployment
1.2.1 Deploy Elasticsearch
(1) Execute the following commands on the server to deploy Elasticsearch
// Download the Elasticsearch image from Baidu AI Cloud Image Registry
sudo docker pull registry.baidubce.com/bce_bls/elasticsearch:8.12.0
// Elasticsearch data storage directory. Please modify according to actual situation.
sudo mkdir /data
// Configure permissions.
sudo chmod 777 /data
// Start ES
sudo docker run -d --name bls-elasticsearch -p 9200:9200 \
-e "discovery.type=single-node" \
-e "ES_JAVA_OPTS=-Xms1G -Xmx1G" \
-e "xpack.security.enabled=true" \
-e "xpack.security.http.ssl.enabled=false" \
-e "ELASTIC_PASSWORD=xxxxx" \
-v /data:/usr/share/elasticsearch/data \
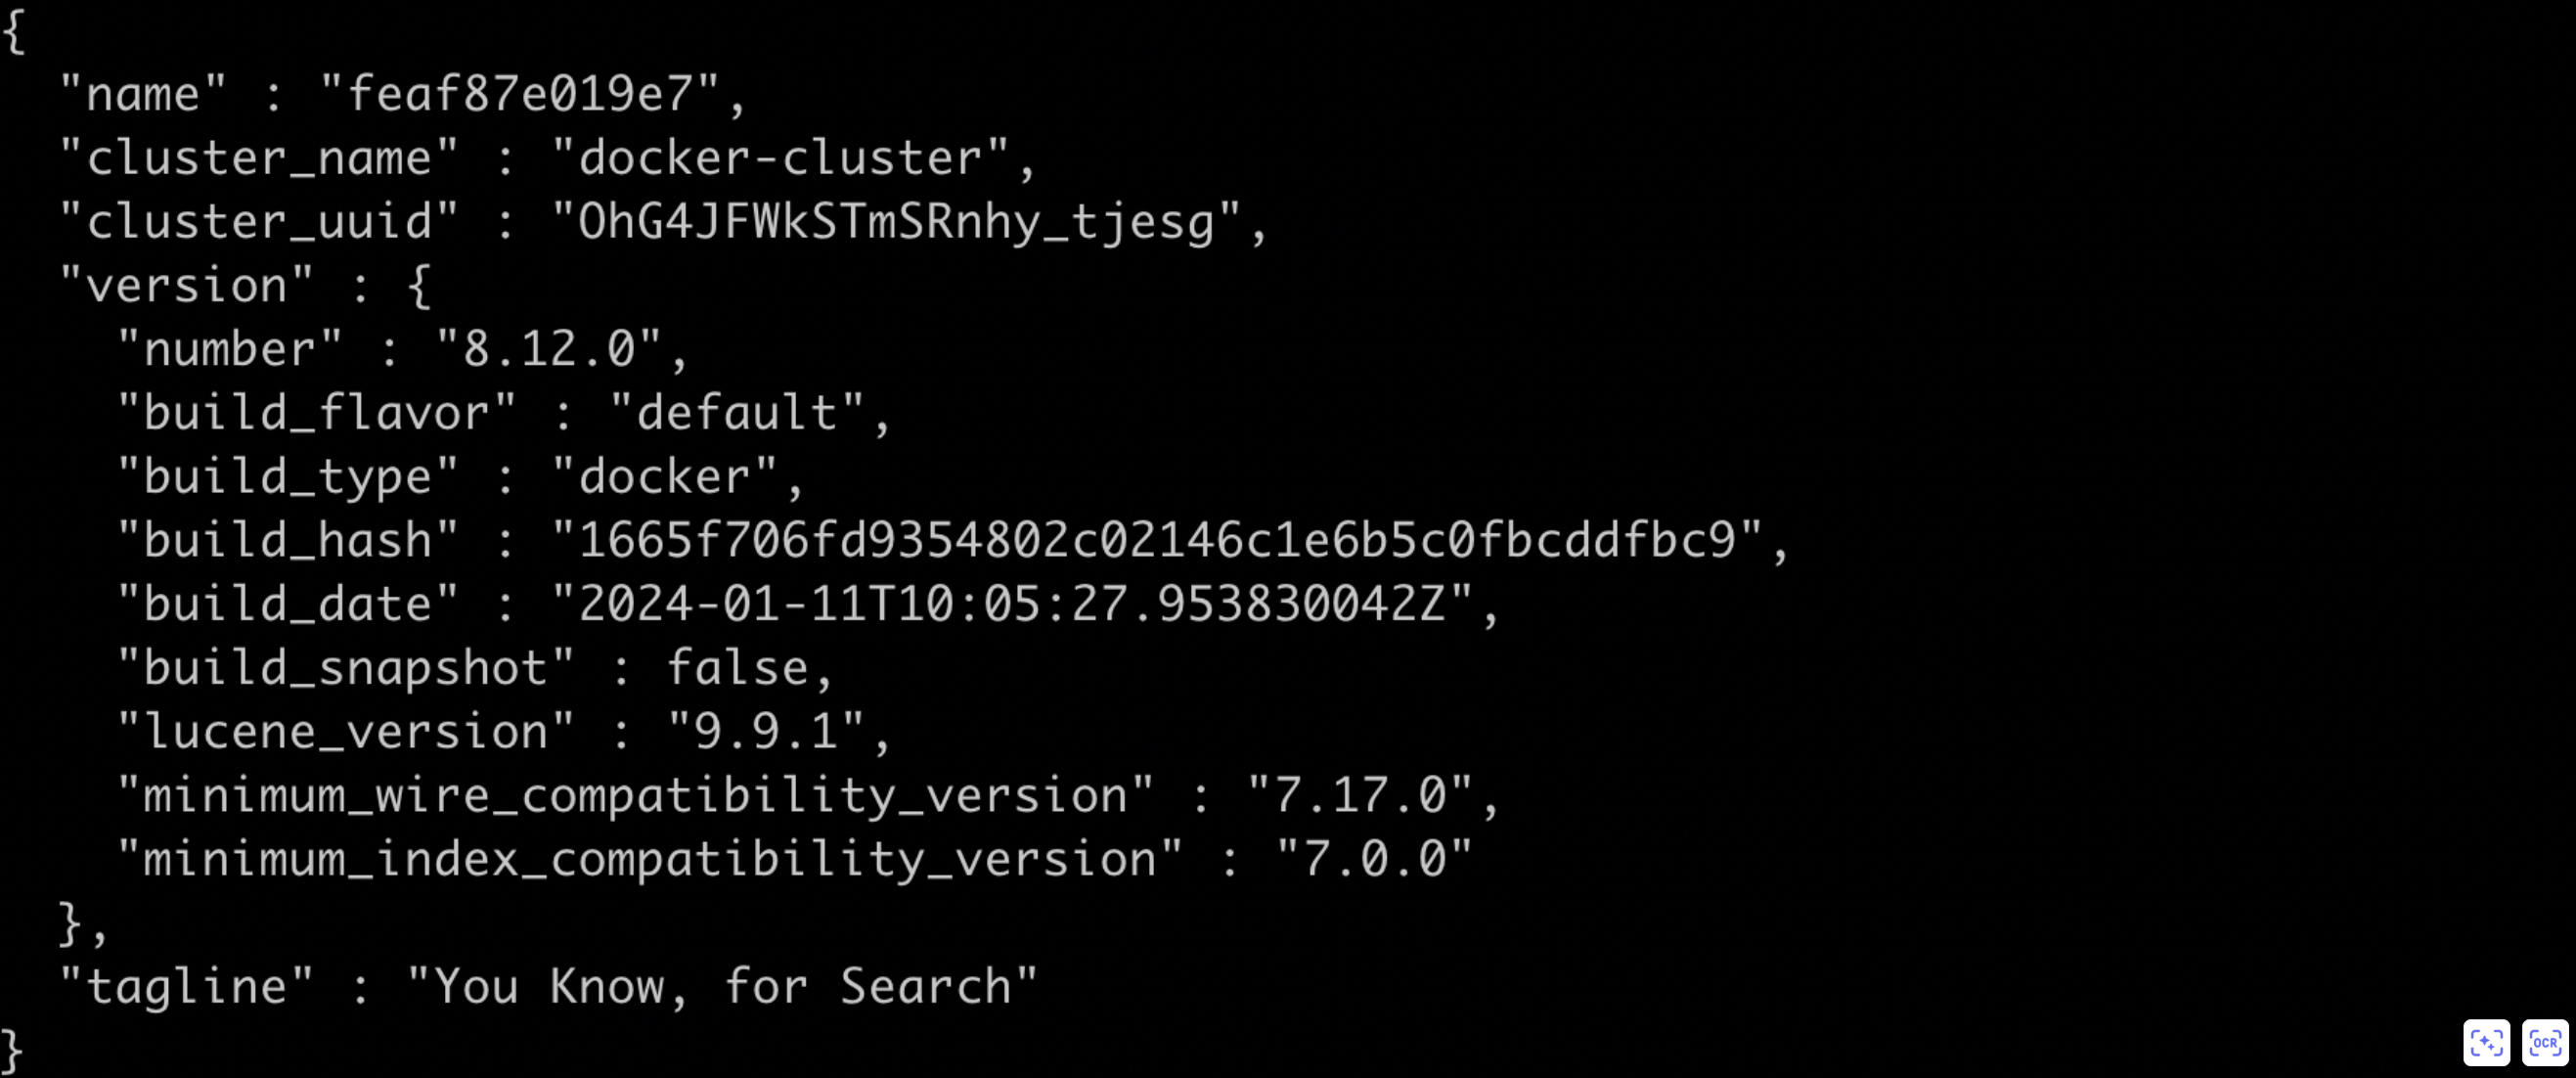
registry.baidubce.com/bce_bls/elasticsearch:8.12.0(2) After deployment, please execute the following command to verify if Elasticsearch has been successfully deployed. If a public IP is used, port 9200 must be added to the server security group rules
curl http://${Elasticsearch machine IP address}:9200If the response result contains data in JSON format as shown below, it indicates that Elasticsearch has been successfully deployed

(3) Create a Kibana access account
curl -u elastic:xxxxx -X POST "http://${Elasticsearch machine IP address}:9200/_security/user/kibana_user" -H "Content-Type: application/json" -d '{
  "password": "kibana_pass",
  "roles": ["kibana_system","kibana_admin"],
  "full_name": "Kibana System User"
}' -k
1.2.2 Deploy proxy
(1) Execute the following command on the server to deploy the bls-es-proxy service
// Download the bls-es-proxy image from Baidu AI Cloud Image Registry
sudo docker pull registry.baidubce.com/bce_bls/bls-es-proxy:latest
// ES_ENDPOINT ES address
// BLS_ENDPOINT BLS address
// AK Baidu AI Cloud account access key
// SK Baidu AI Cloud account access key
// USER_ID Baidu AI Cloud account ID
sudo docker run  -d --name bls-es-proxy \
            -e ES_ENDPOINT=$\{Elasticsearch machine IP address}:9200 \
            -e BLS_ENDPOINT=$\{BLS domain name} \
            -e AK=${baiduyunAccessId} \
            -e SK=${baiduyunAccessKey} \
            -e USER_ID=${baiduyunAccessKey} \
            -p 8077:8077 \
            registry.baidubce.com/bce_bls/bls-es-proxy:latest
(2) After deployment, please execute the following command to verify if bls-es-proxy has been successfully deployed. If a public IP is used, port 8077 must be added to the server security group rules.
curl http://${bls-es-proxy machine IP address}:8077If the response result contains data in JSON format as shown below, it indicates that bls-es-proxy has been successfully deployed
1.2.3 Deploy Kibana
See the following example for Kibana deployment. This article takes Kibana Version 8.12.0 as an example.
// Download the Kibana image from Baidu AI Cloud
sudo docker pull registry.baidubce.com/bce_bls/kibana:8.12.0
// ELASTICSEARCH_HOSTS proxy address
sudo docker run -d --name bls-kibana \
            -e ELASTICSEARCH_HOSTS=http://$\{Proxy machine IP address}:8077 \
            -e ELASTICSEARCH_USERNAME=kibana_user \
            -e ELASTICSEARCH_PASSWORD=kibana_pass \
            -p 5601:5601 \
            registry.baidubce.com/bce_bls/kibana:8.12.0
After deployment, enter http://${deploy Kibana IP address}:5601 in the browser to access Kibana page. If a public IP is used, port 9200 must be added to the server security group rules
2. Access Kibana
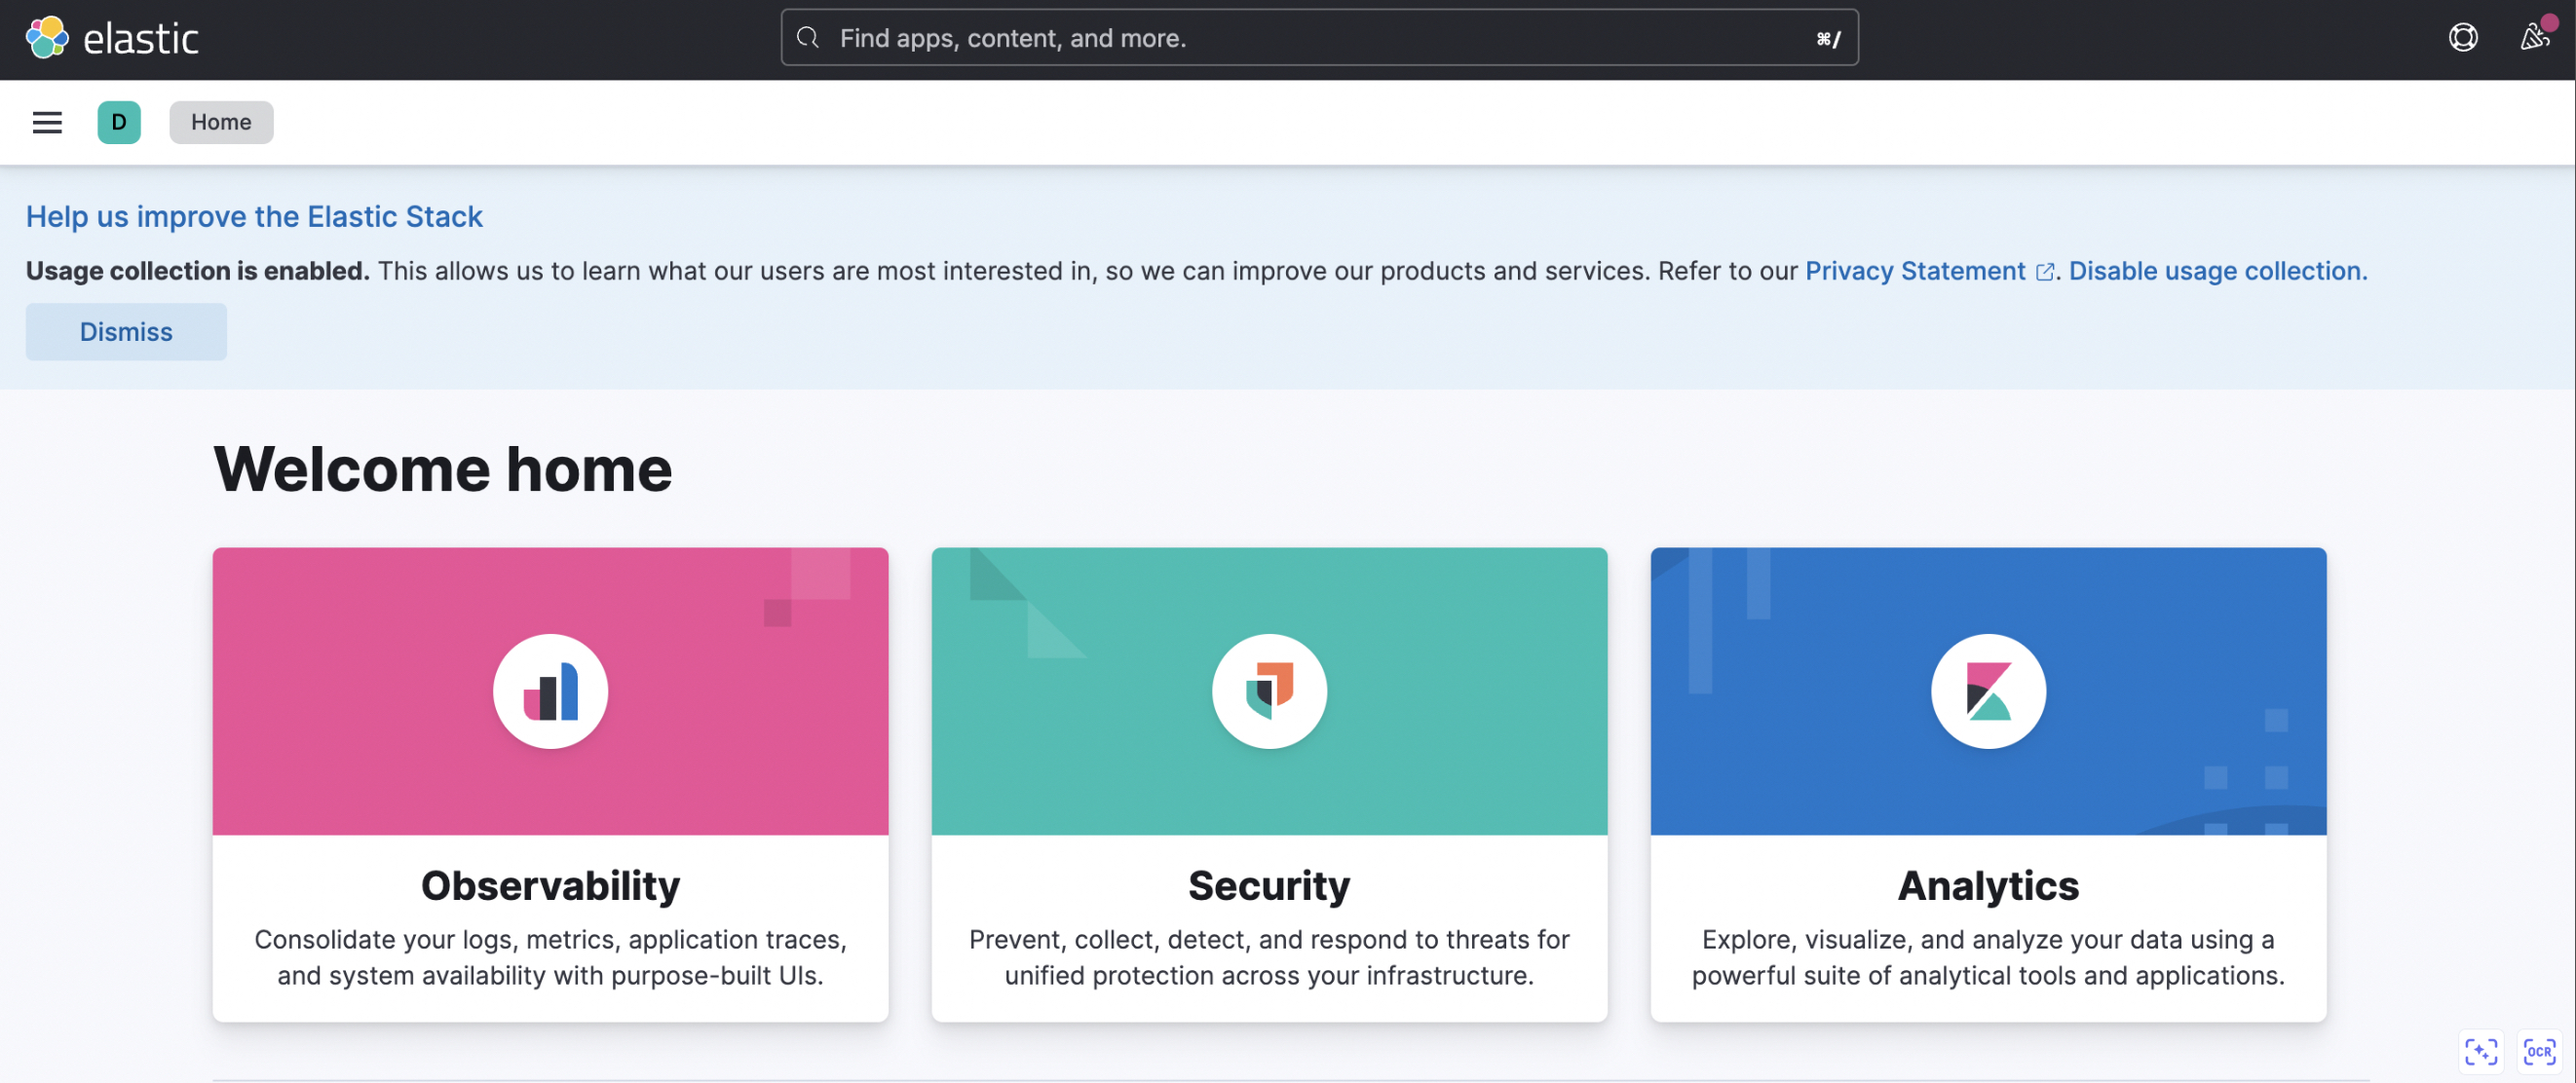
2.1 Access Kibana service via browser
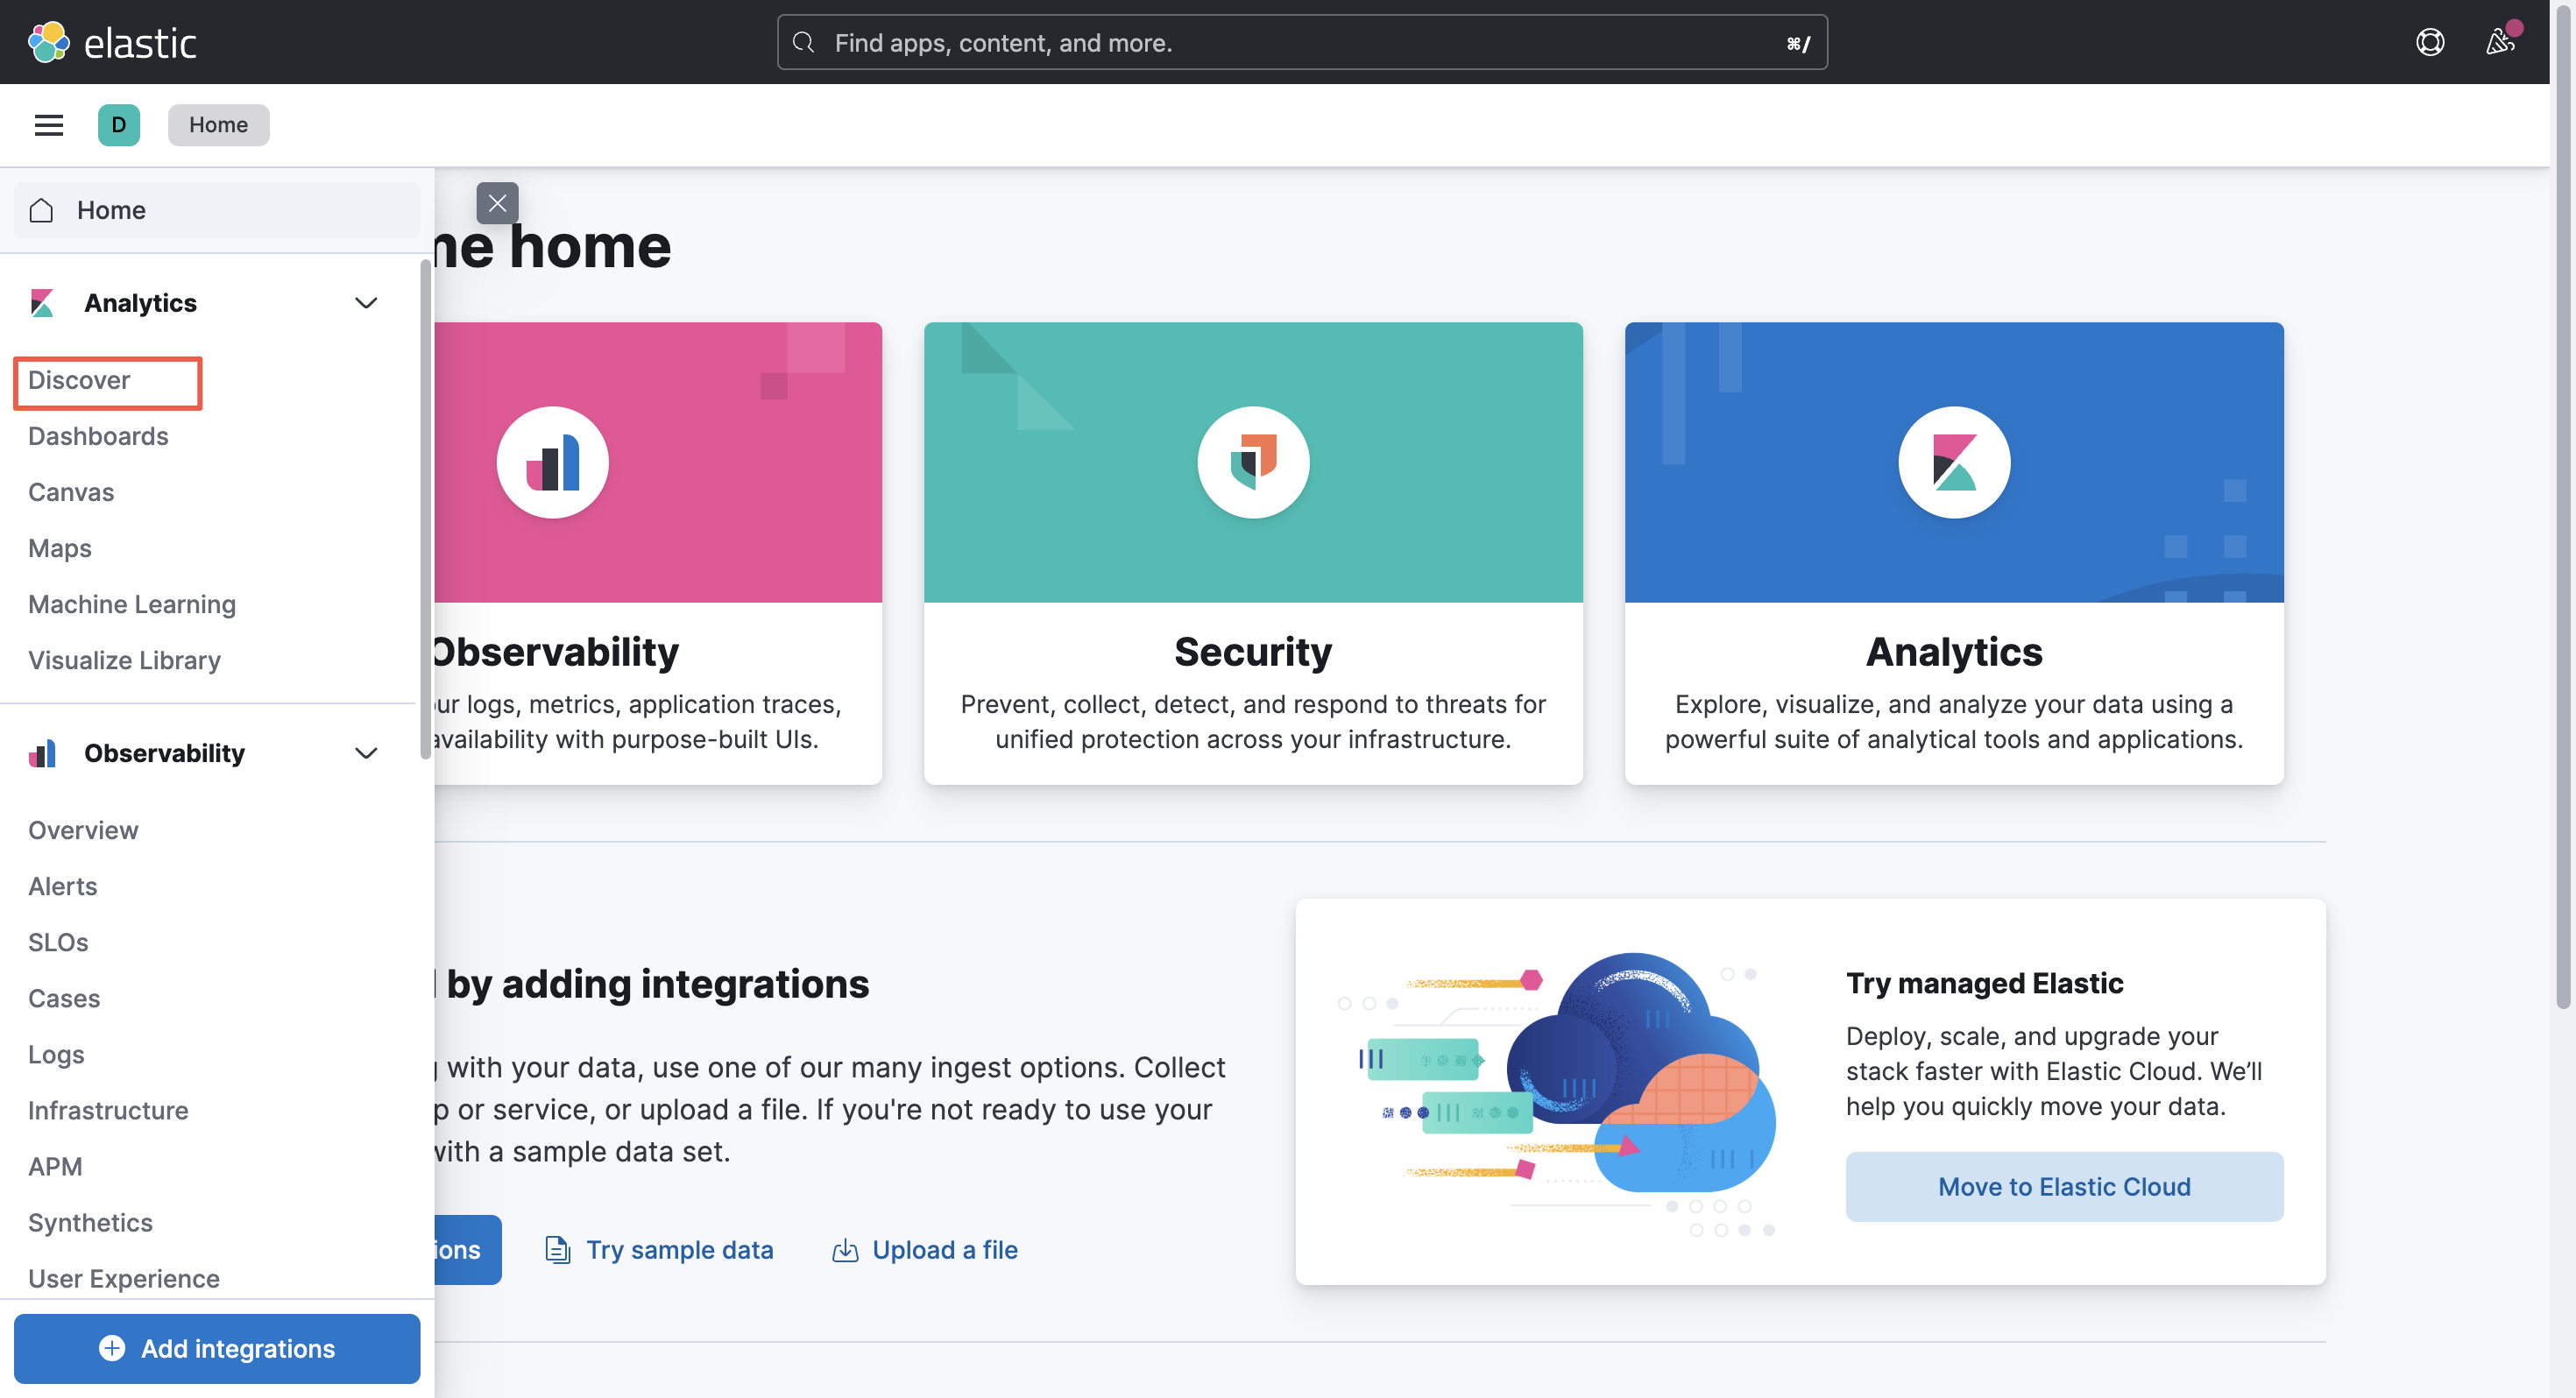
Enter http://localhost:30601/ in the browser. Select Analytics - Discover in the left navigation bar
Important: When the log service data is analyzed via compatible APIs of Kibana and Elasticsearch, Discover and Dashboards modules can only be used.
2.2 Create data view
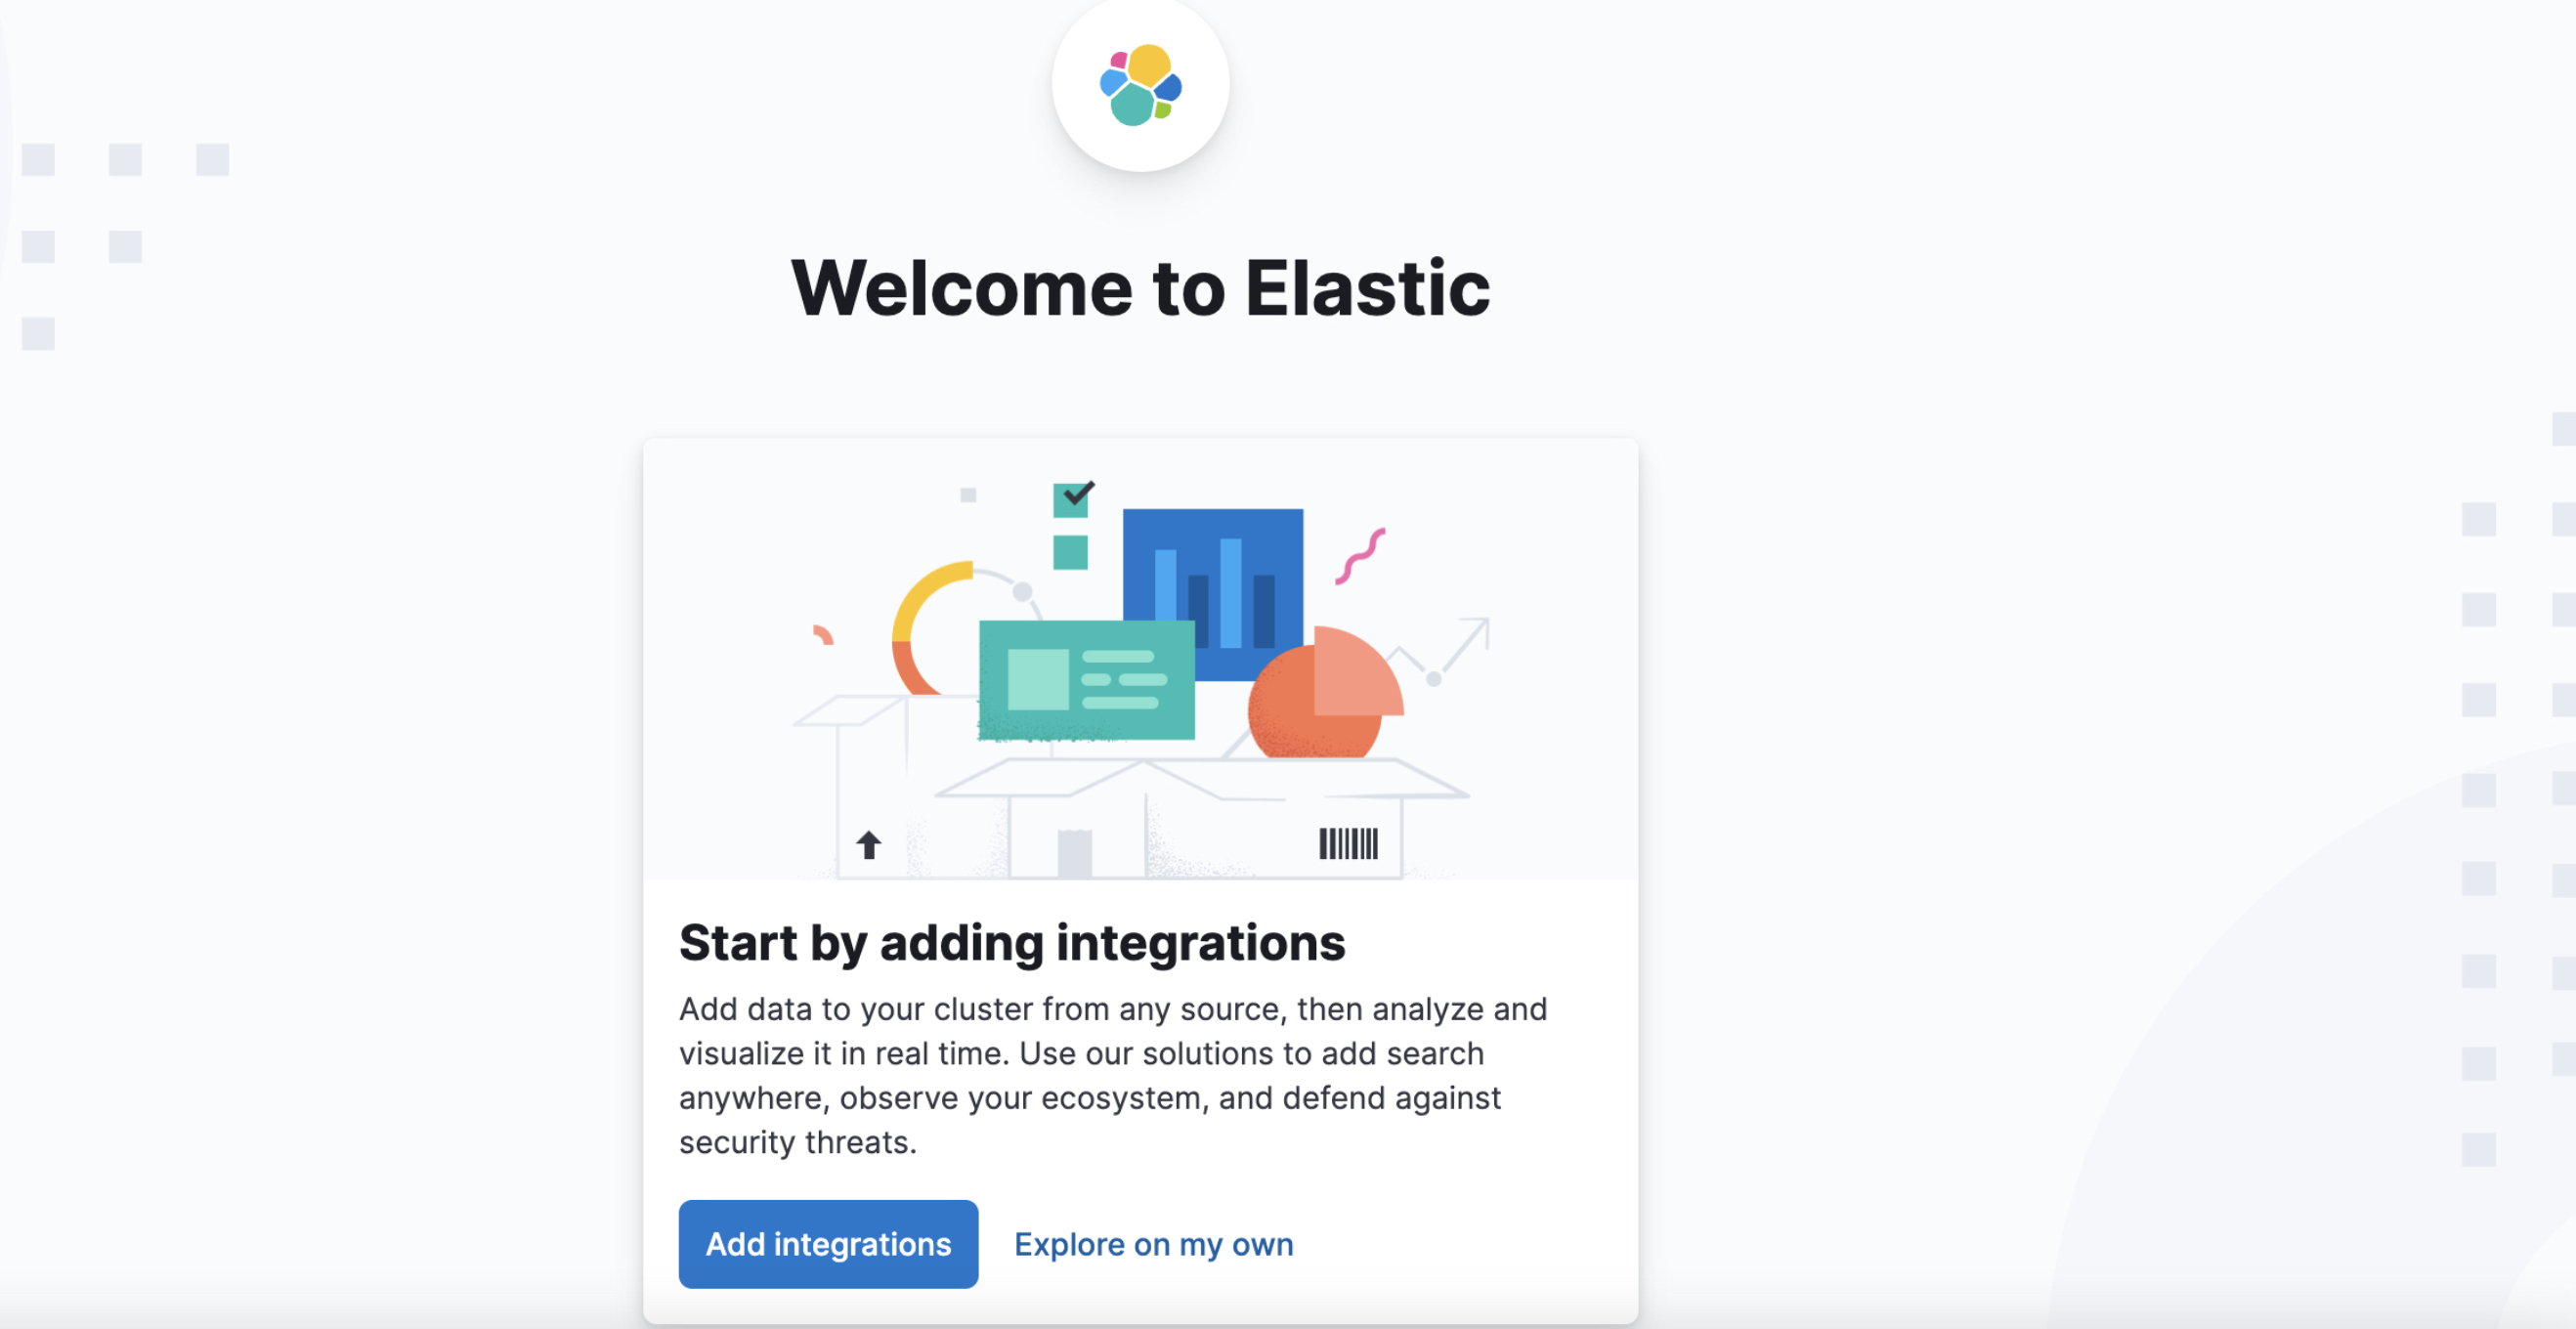
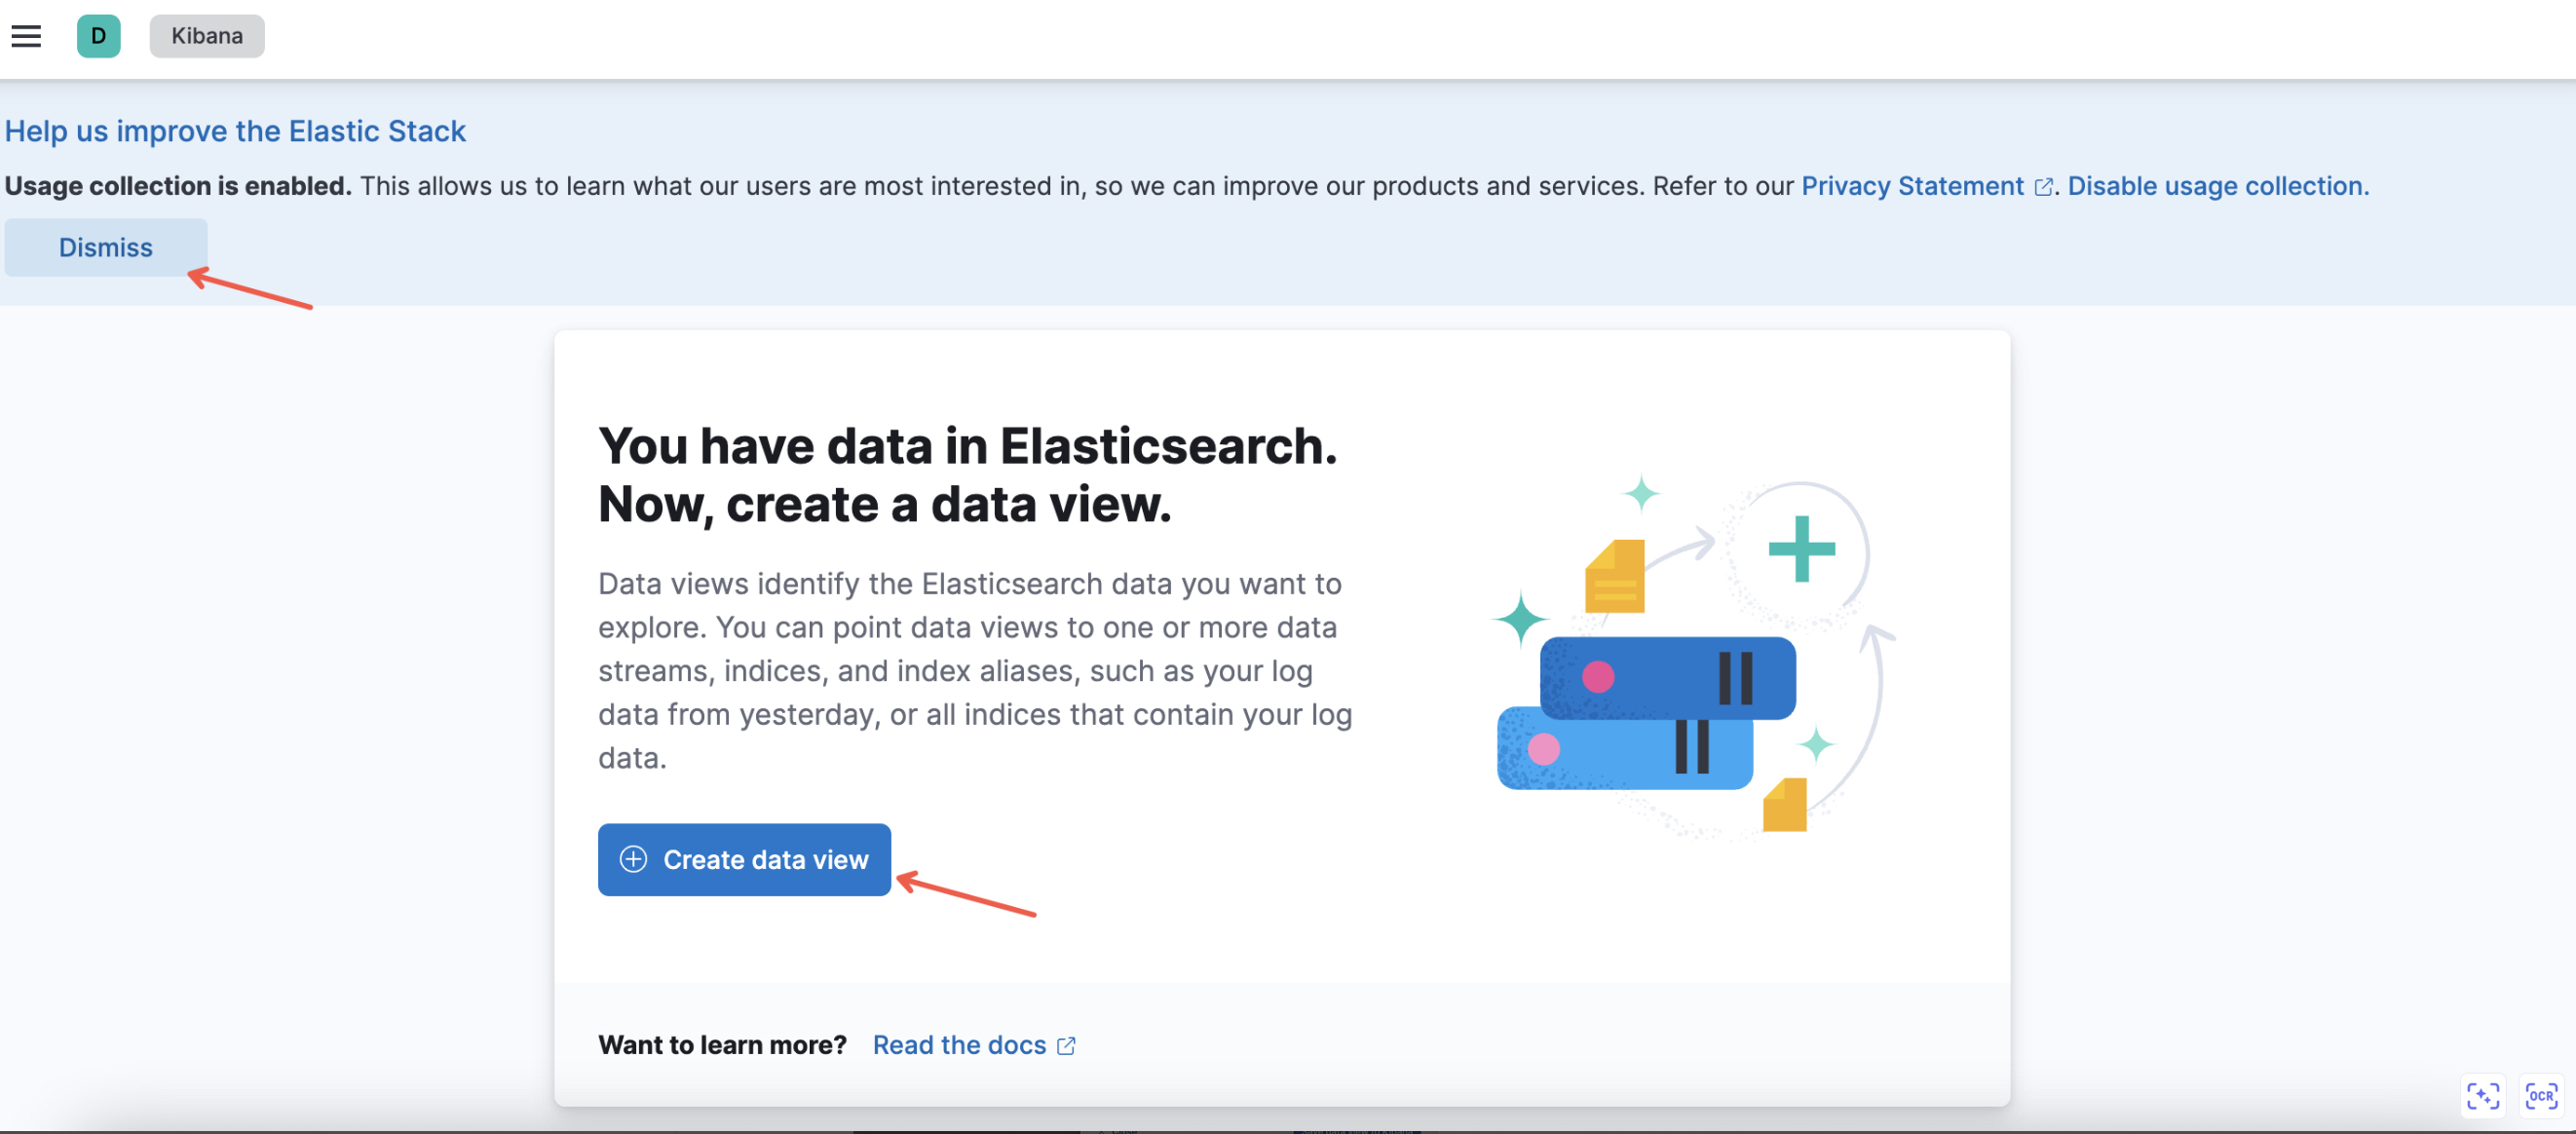
(1) If it is used for the first time, the following API will appear. You can dismiss the help and choose to create a data view.
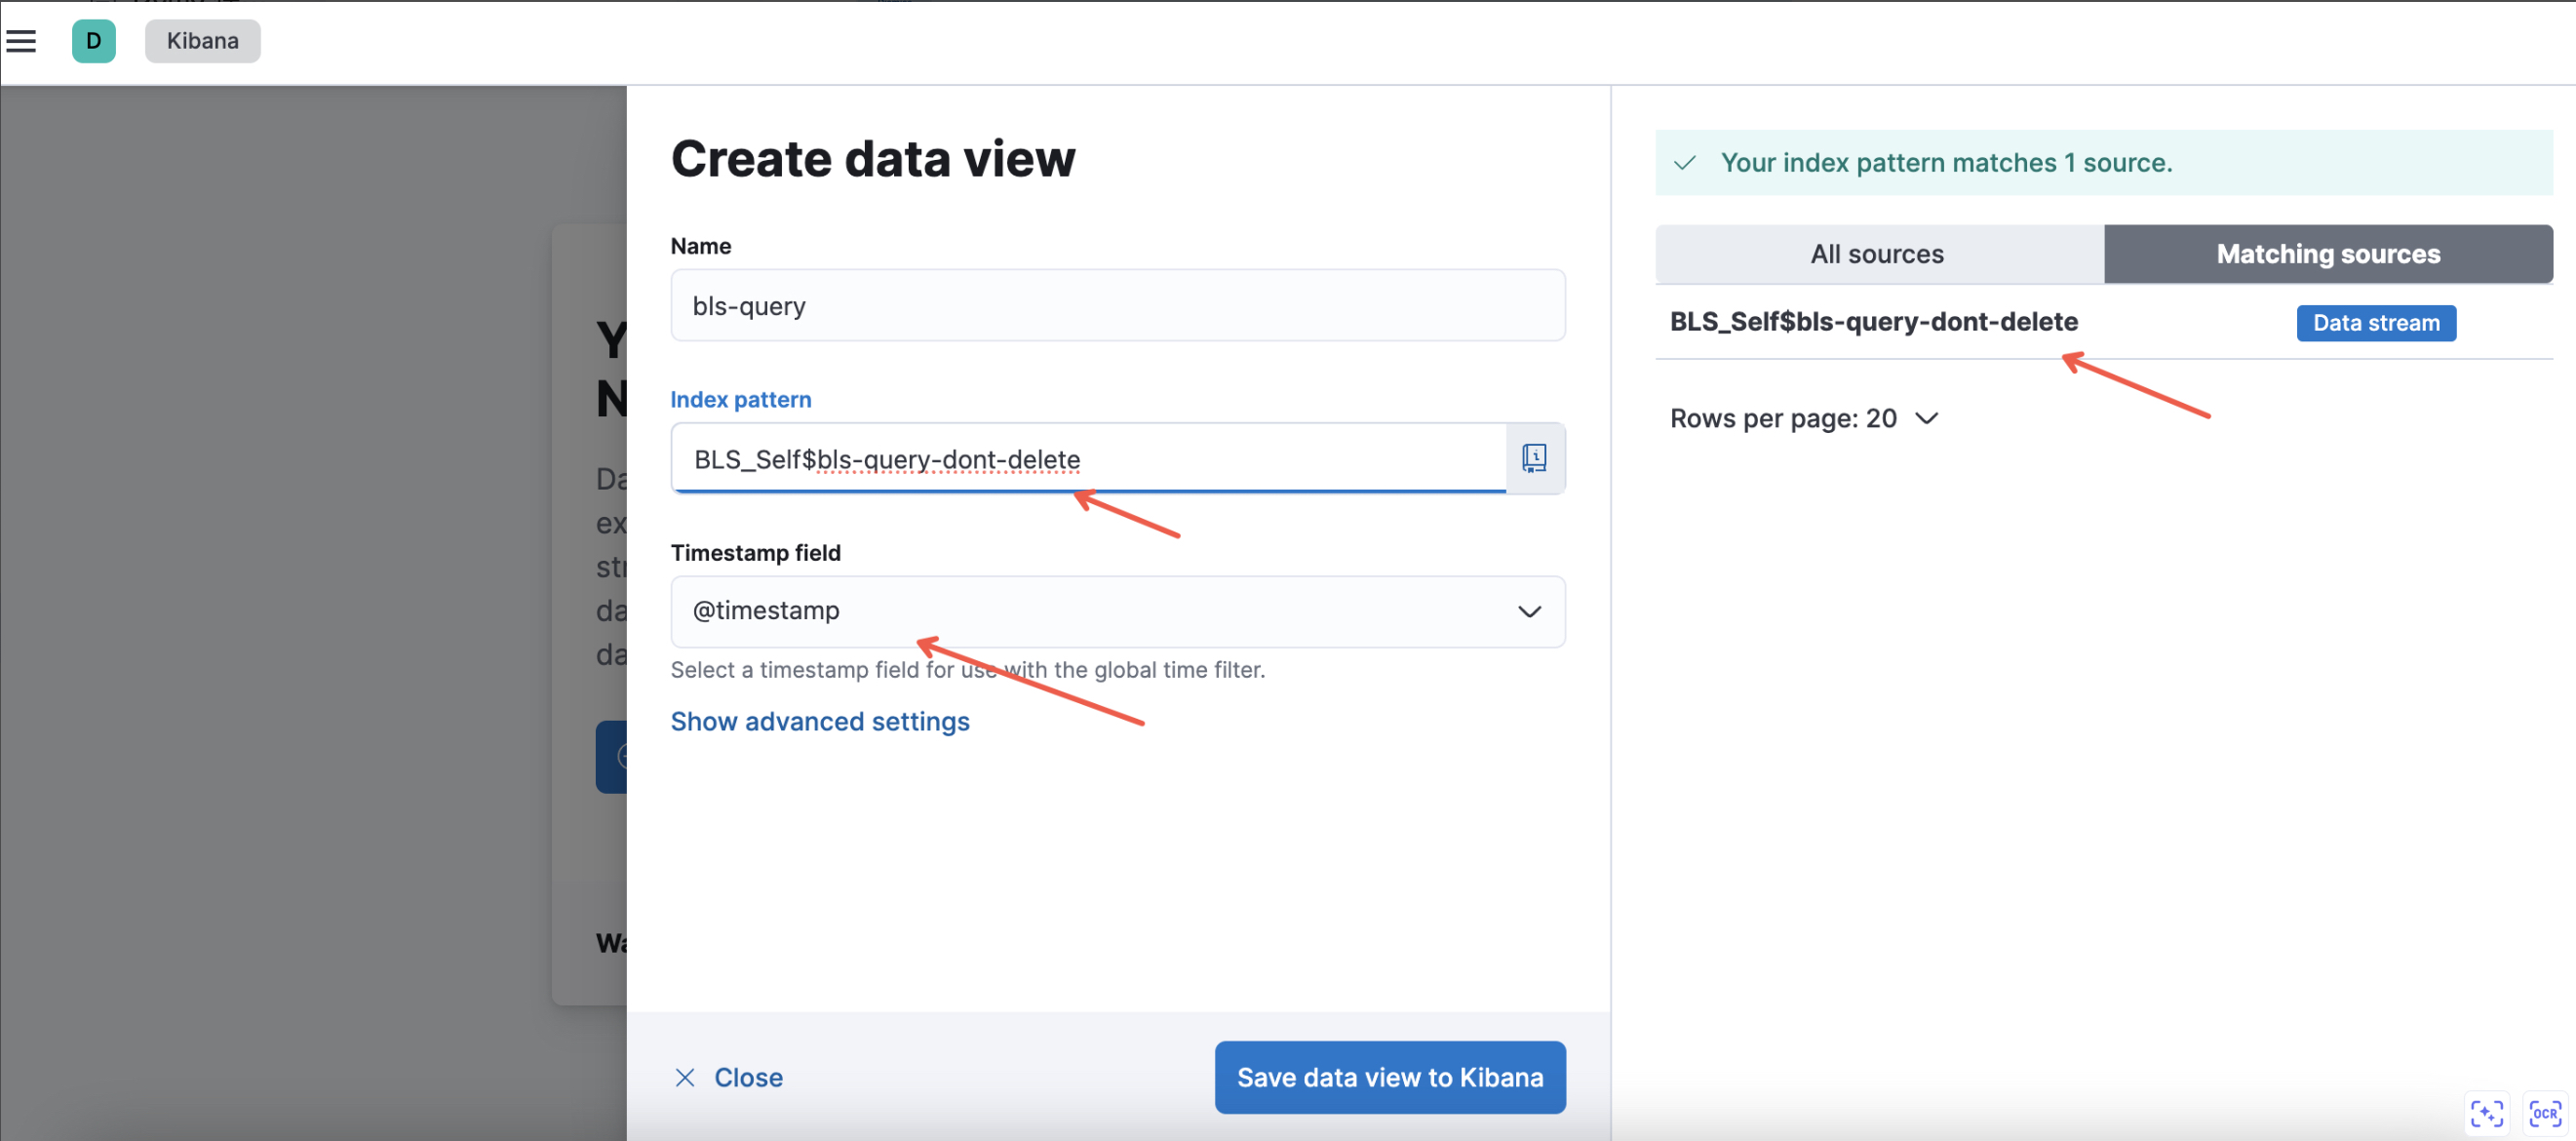
Then, set a name for the data view, and select the corresponding BLS logstore. For a logstore in the default project, enter the logstore content directly and select the specific logstore on the right. If not a default project, separate the BLS project and logstore name by $. After setting, save the data view to Kibana.
Important: The full name must be used here, rather than * wildcard. The time field must remain the default @timestamp.
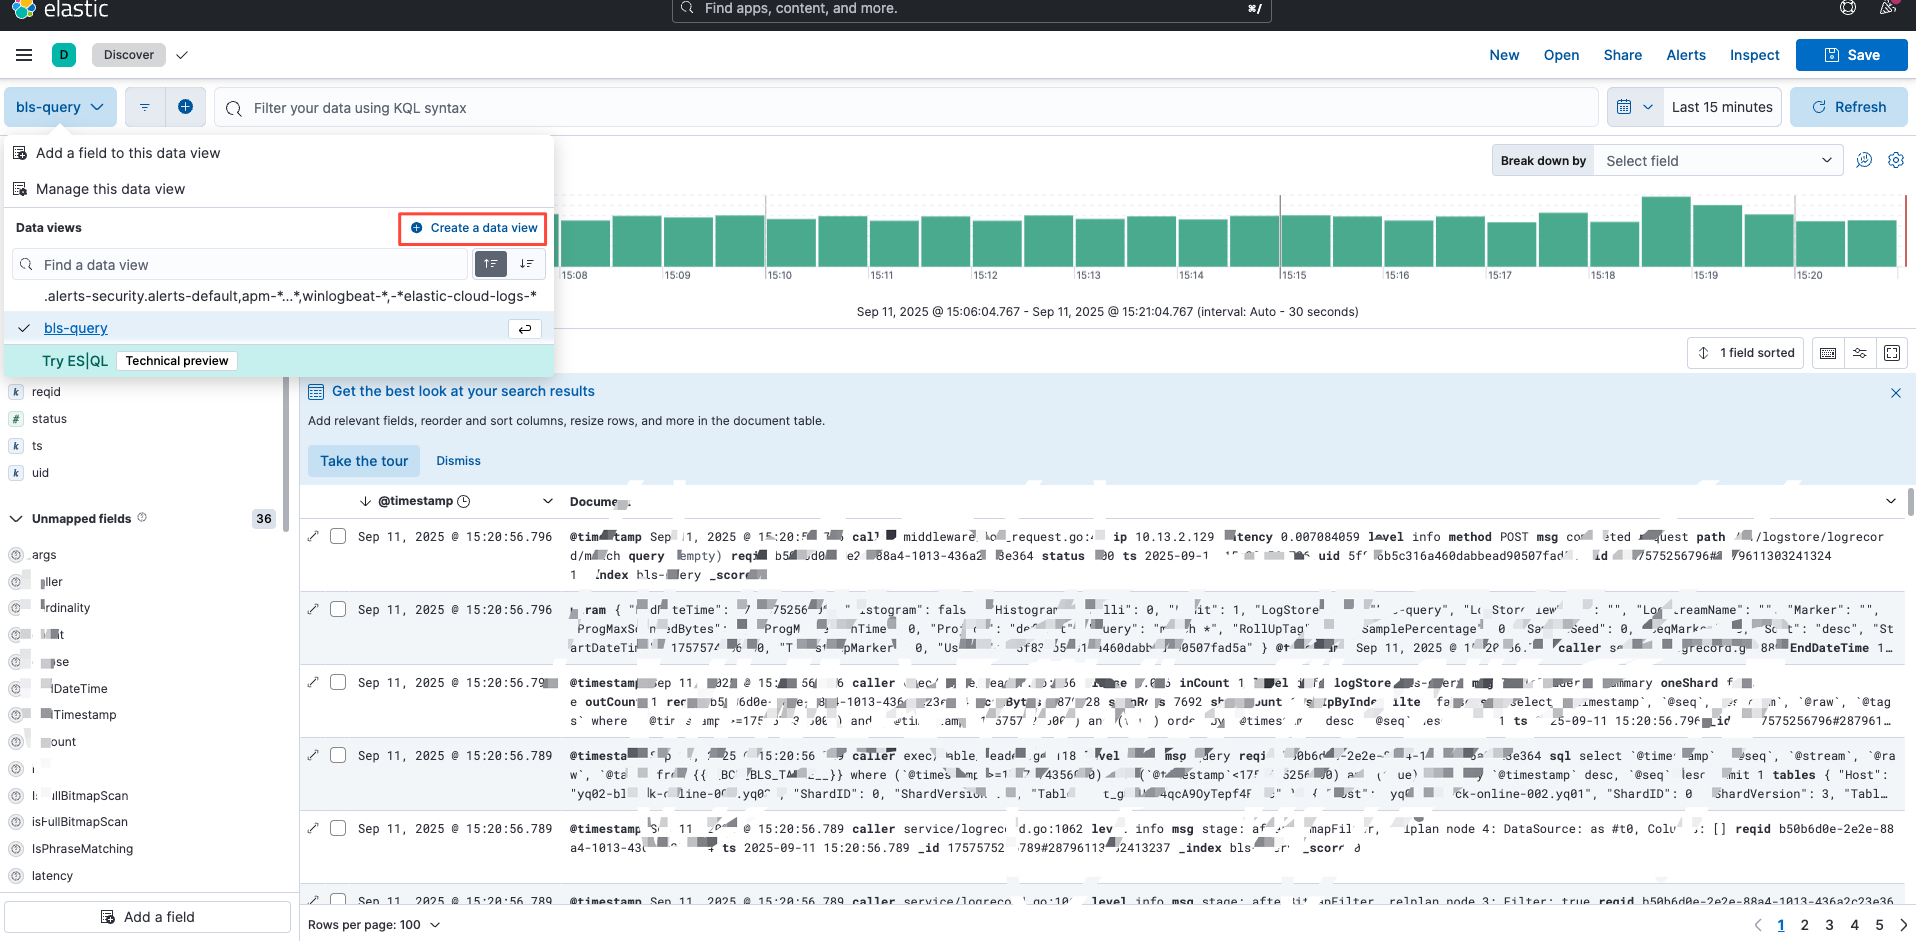
(2) Click Analytics - Discover - Data View Dropdown - Create Data View to add a data view later.
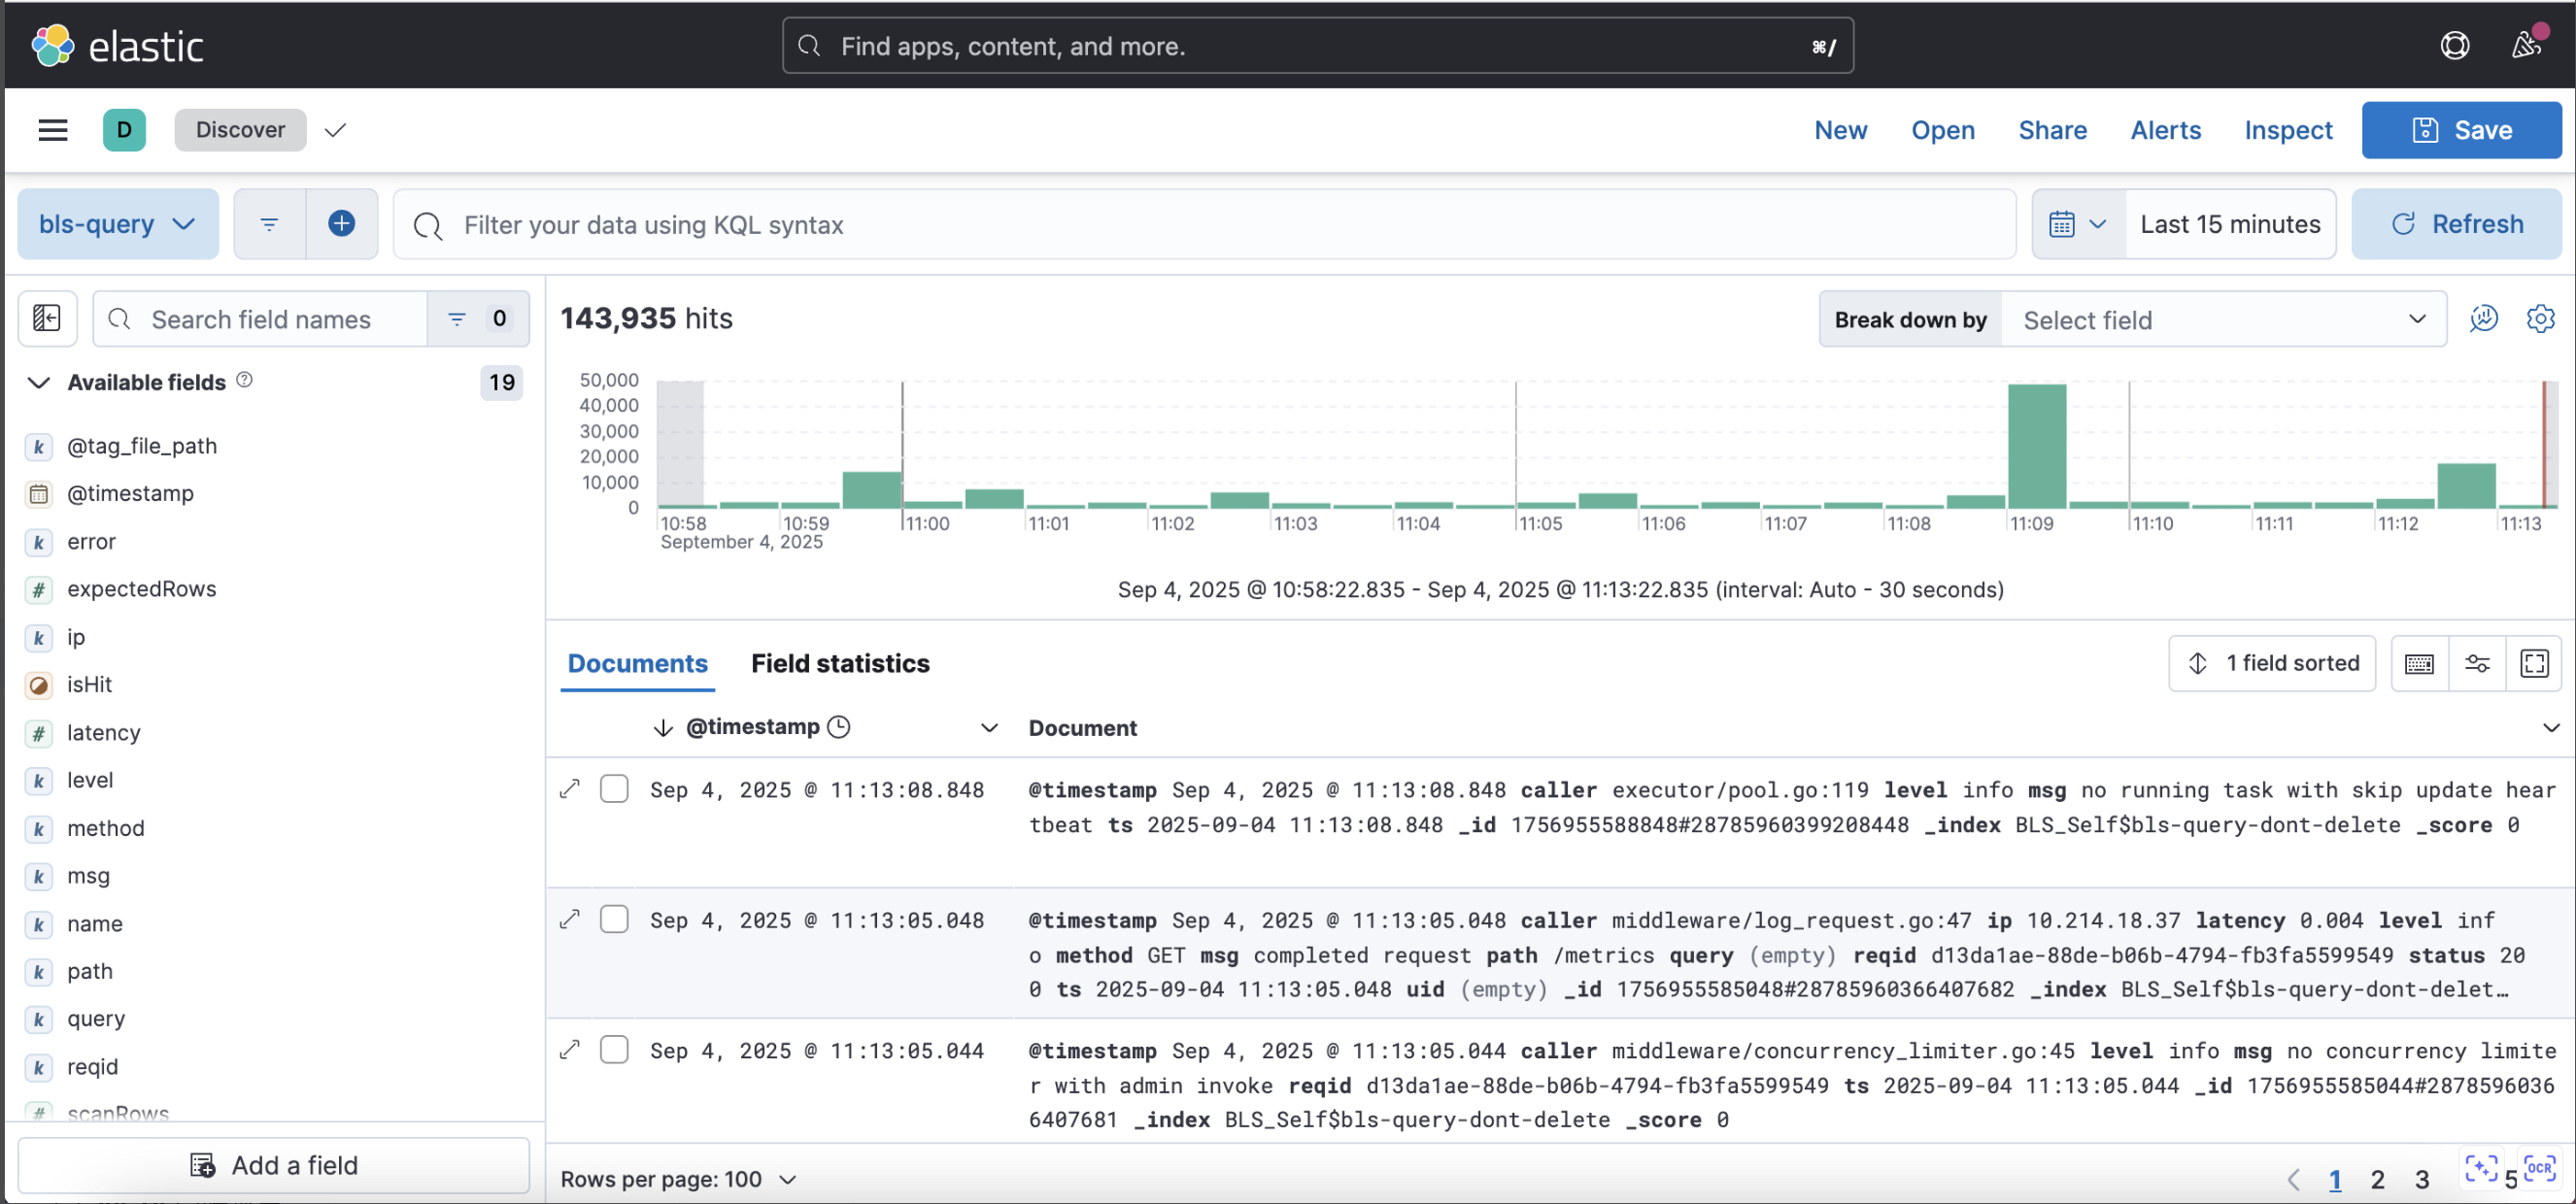
2.3 Use view
Select the target view and time range respectively in the upper left corner and the upper right corner of the page to query log data.
3. Query example
(1) Specified field query is recommended as it is more efficient than full-text search query
level: "info"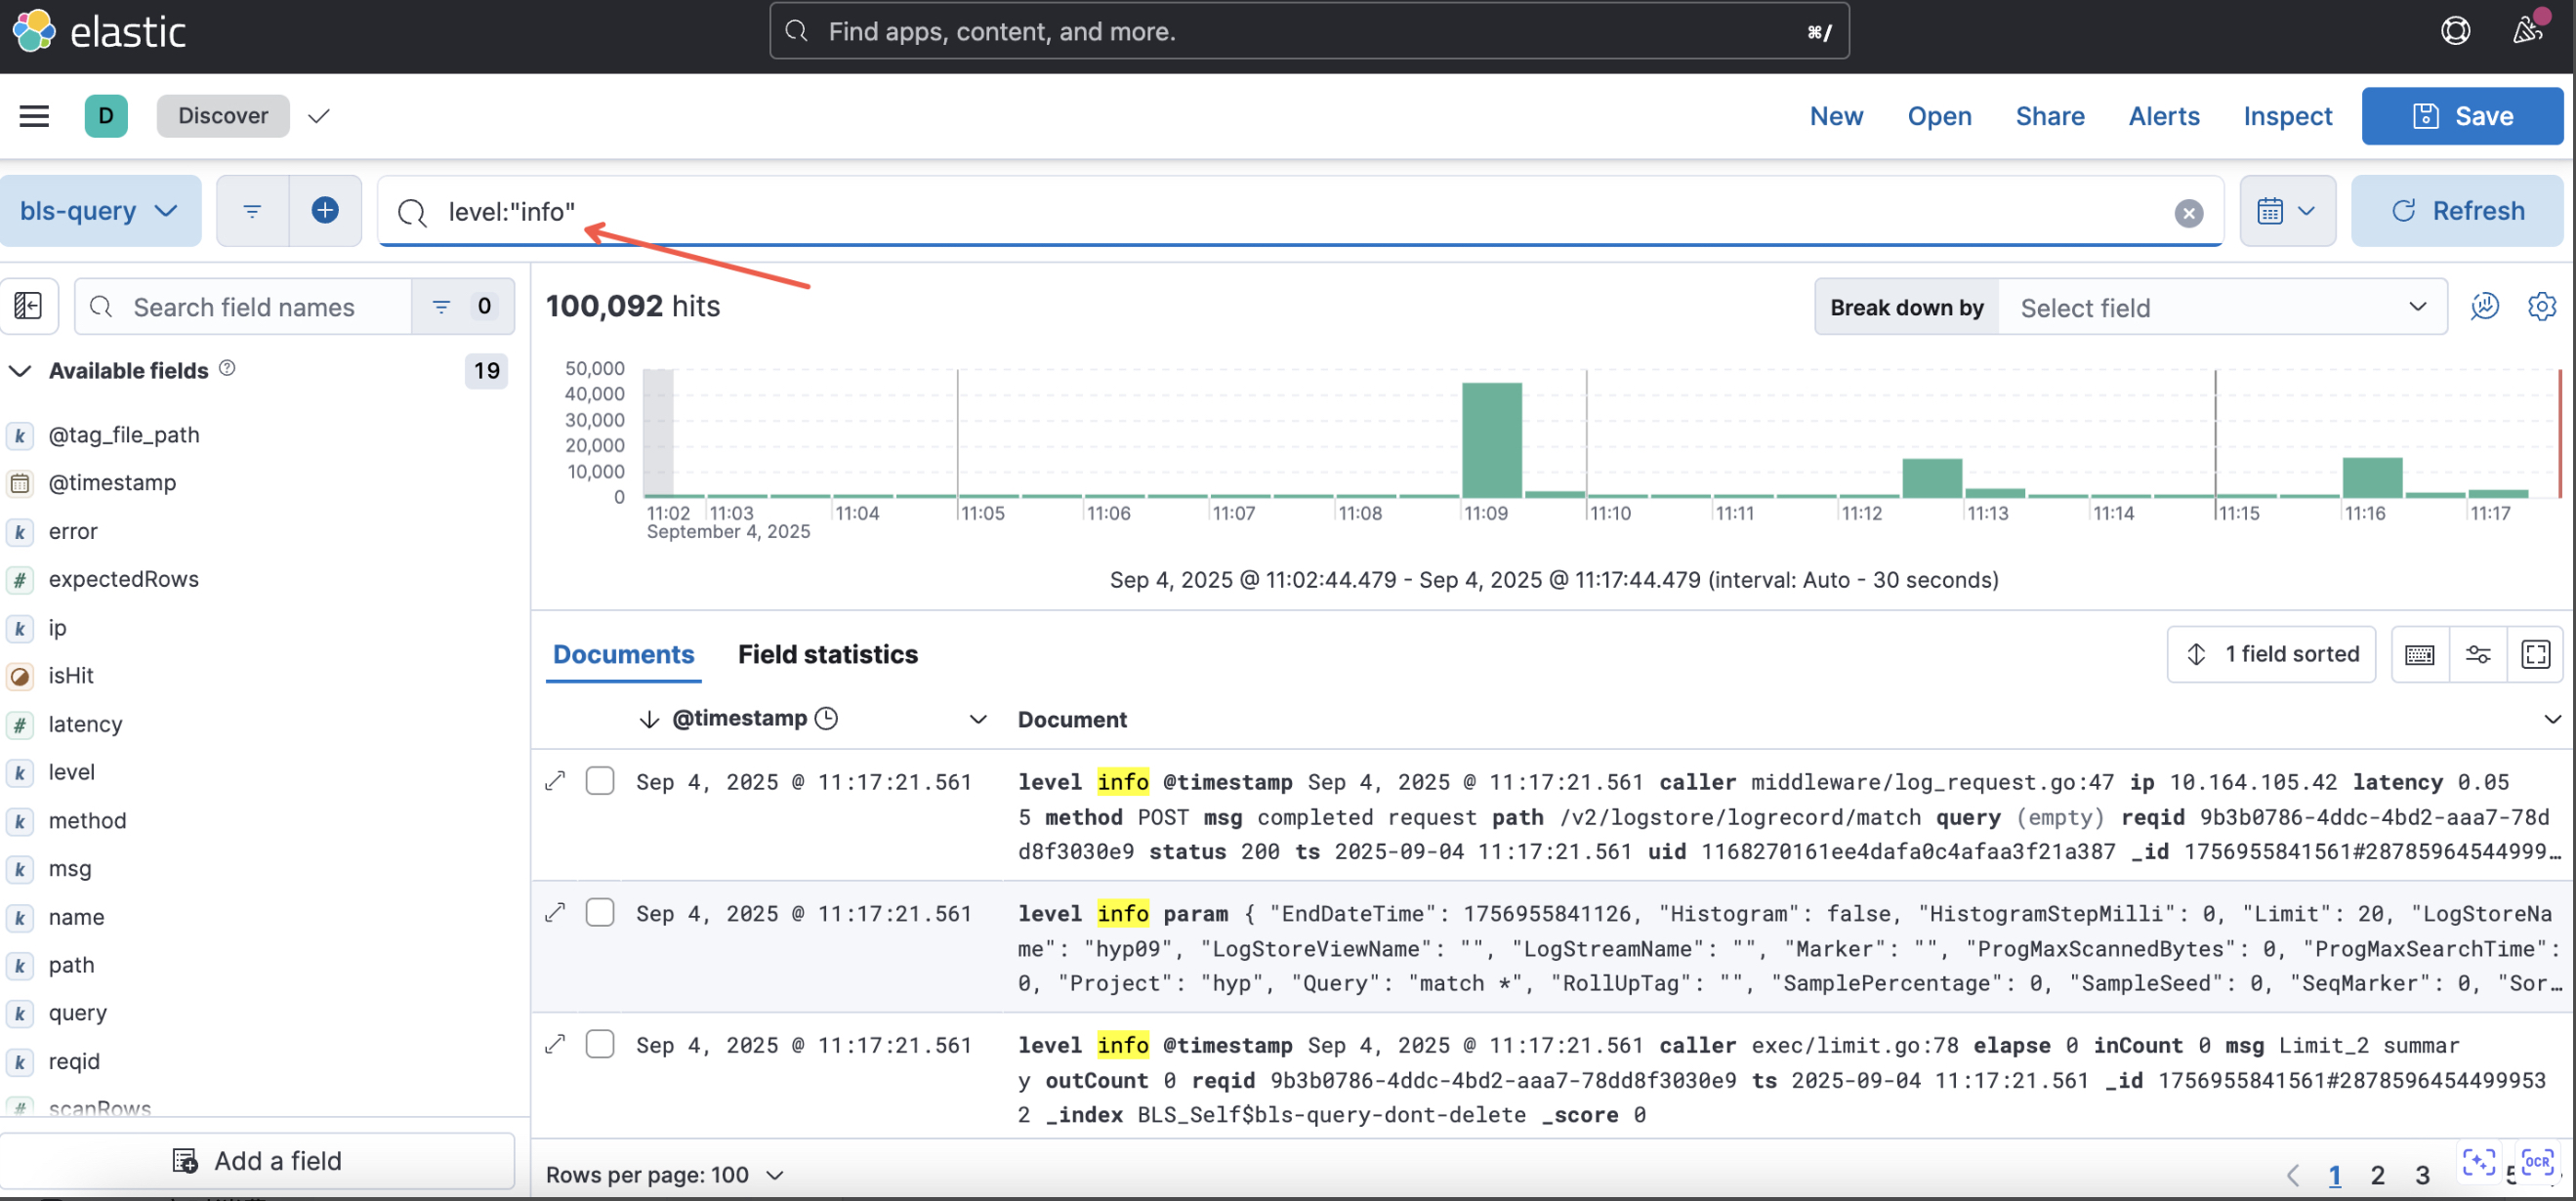
In some cases, the following full-text search query statement may be translated into SQL fields, concatenated, and then matched, resulting in inefficient query
"info"(2) Query by exact match is more efficient than query by * wildcard
method:"POST"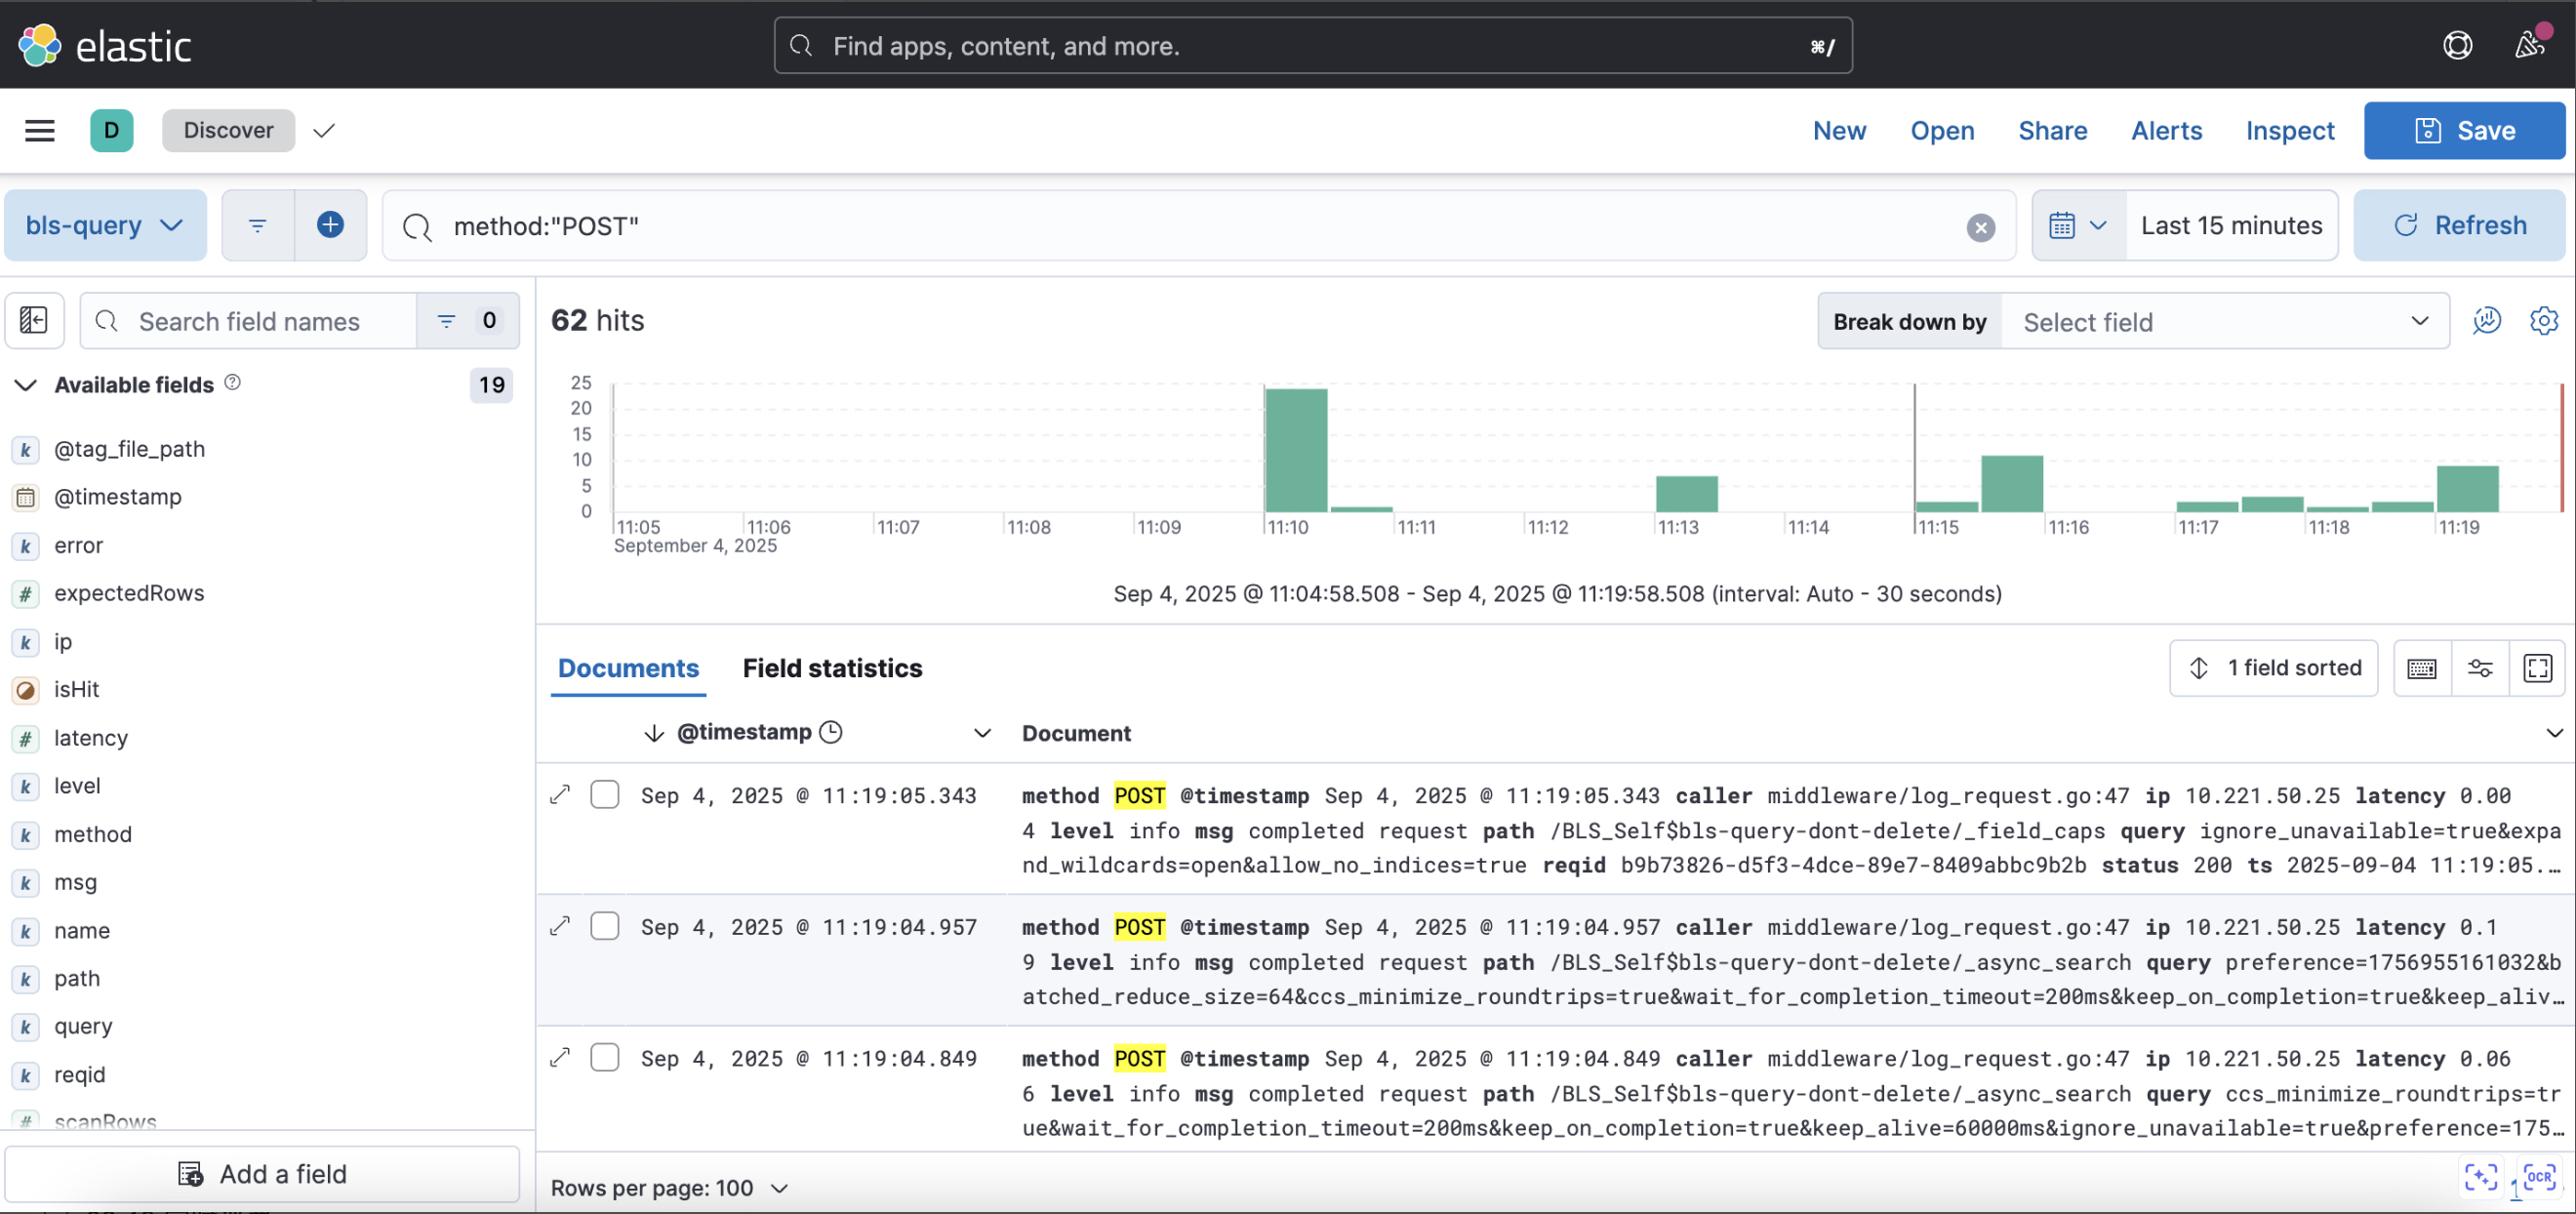
The following query statement by * wildcard is unfriendly as it triggers full-text scan, which can increase response time in case of large data volume.
method:"PO*"