Log Analysis and Alerting
Once LogStore and its corresponding transmission task are set up, you can utilize the log query function for analysis, configure log alarms for notifications, and create visual dashboards for enhanced monitoring.
Log query analysis
- Sign in to the Baidu AI Cloud official website, click Management Console in the top-right corner to quickly access the console interface.
- Go to Product Service > Baidu Log Service (BLS) and navigate to Query Analysis -> Log Query page.
-
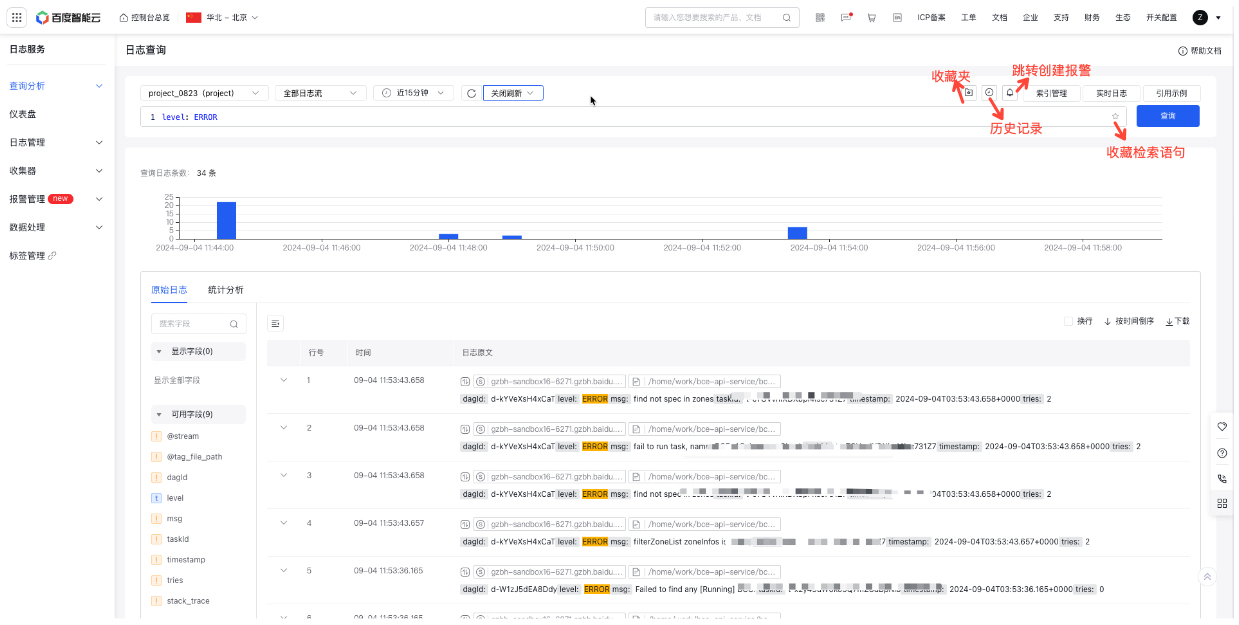
Choose LogStore, logstream, and the desired time range. Enter SQL statements in the SQL editor or refer to example SQL statements, then click Query to execute the statement and view results below.
- LogStore Selection: Choose from user-created LogStores in the current region or manually input a LogStore name to filter.
- Logstream Selection: Specify the logstream within the chosen LogStore. Leave blank to query all logstreams.
- Auto-refresh: By default, data query results are not automatically refreshed. When the auto-refresh period is selected, the query statement will run automatically and refresh the results at regular intervals.
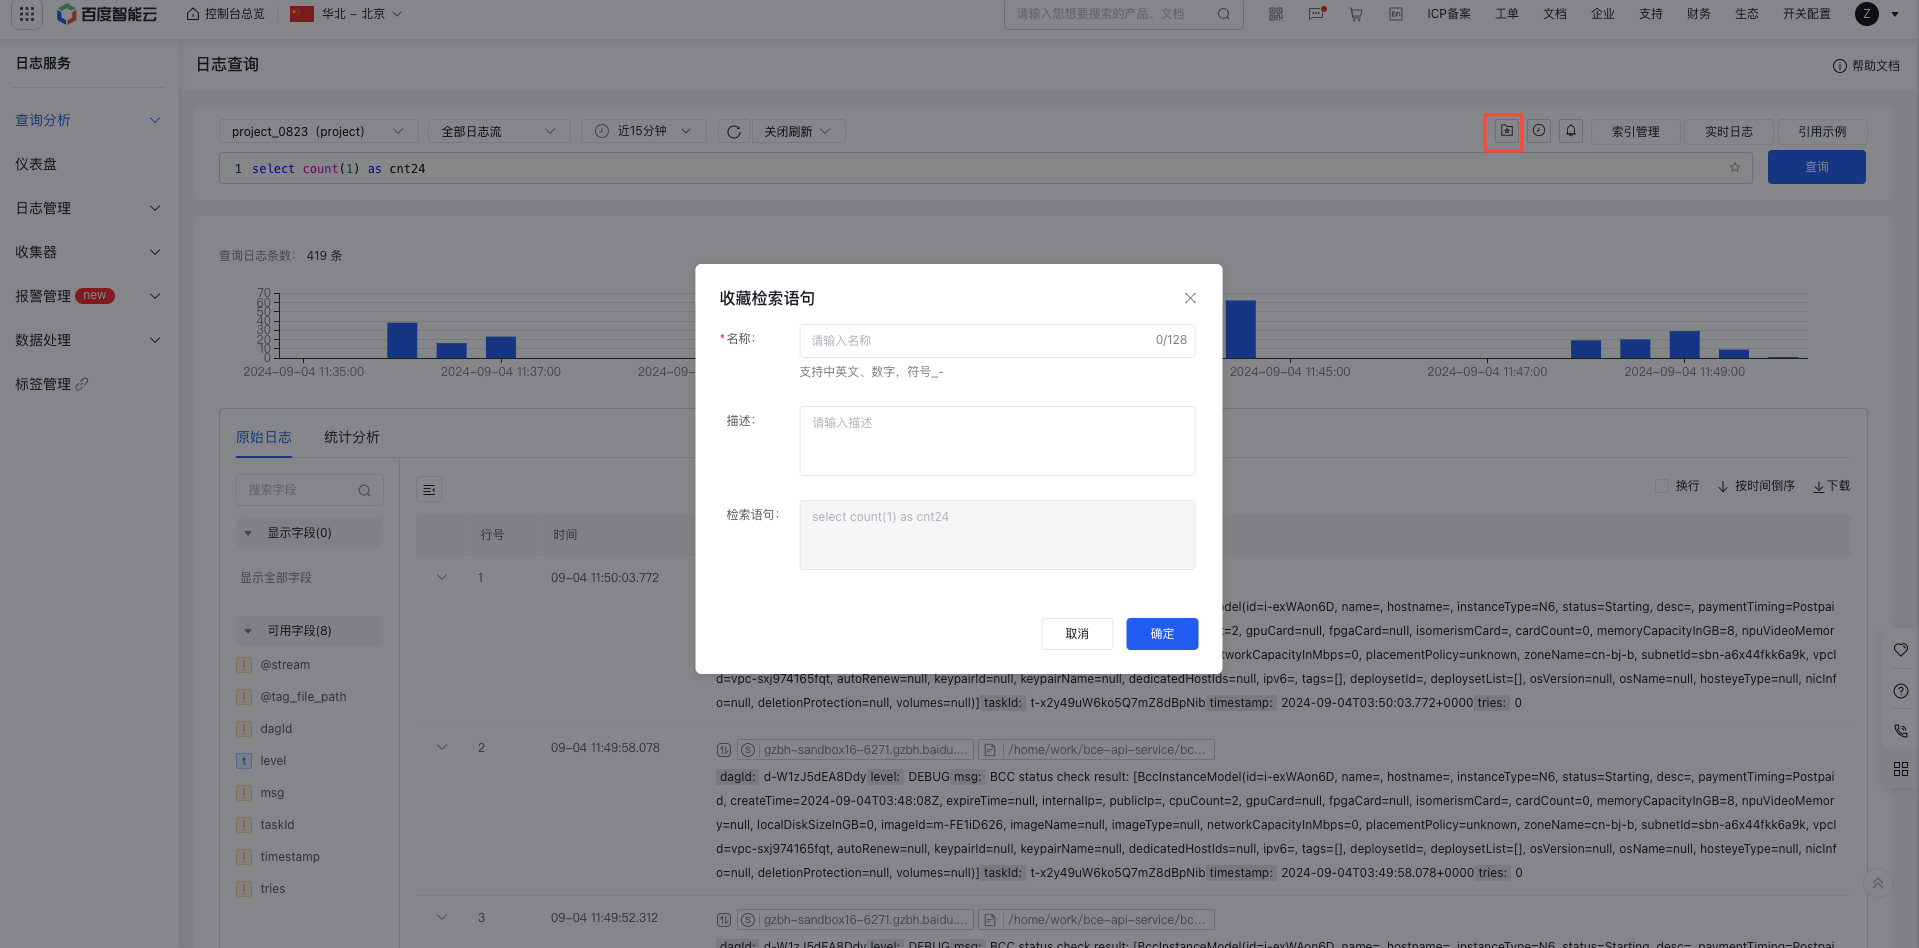
- Preferred query option: If you often need to revisit the results of this query, click the Favorite button to save the current query to your favorites. Access your favorites to automatically run the query and view the results.
- History Records: Open the History Records pop-up to quickly select and run recently used query statements, with results automatically displayed.
- Quick jump alarm: Click the Jump Alarm icon to bring LogStore, and the query statement can quickly redirect to the Alarm Creation page to configure the alarm
Create Alarm Strategy
Log in to Baidu AI Cloud, navigate to Log Service, and click
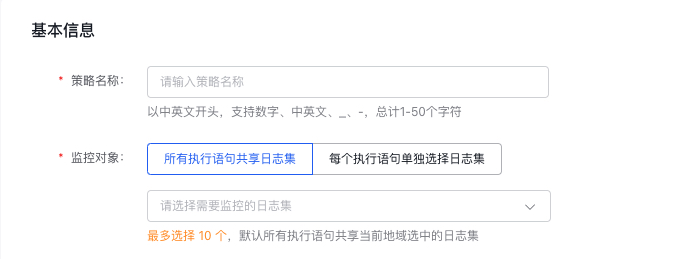
Configure basic information
In "Basic Information," please enter the alarm strategy name. In "Monitor Object", select the LogStore to be monitored. Supports two methods: sharing LogStores across execution statements or selecting LogStores individually for each execution statement. The former supports selecting multiple LogStores (up to 10), while the latter is single-choice
Configure alarm rules
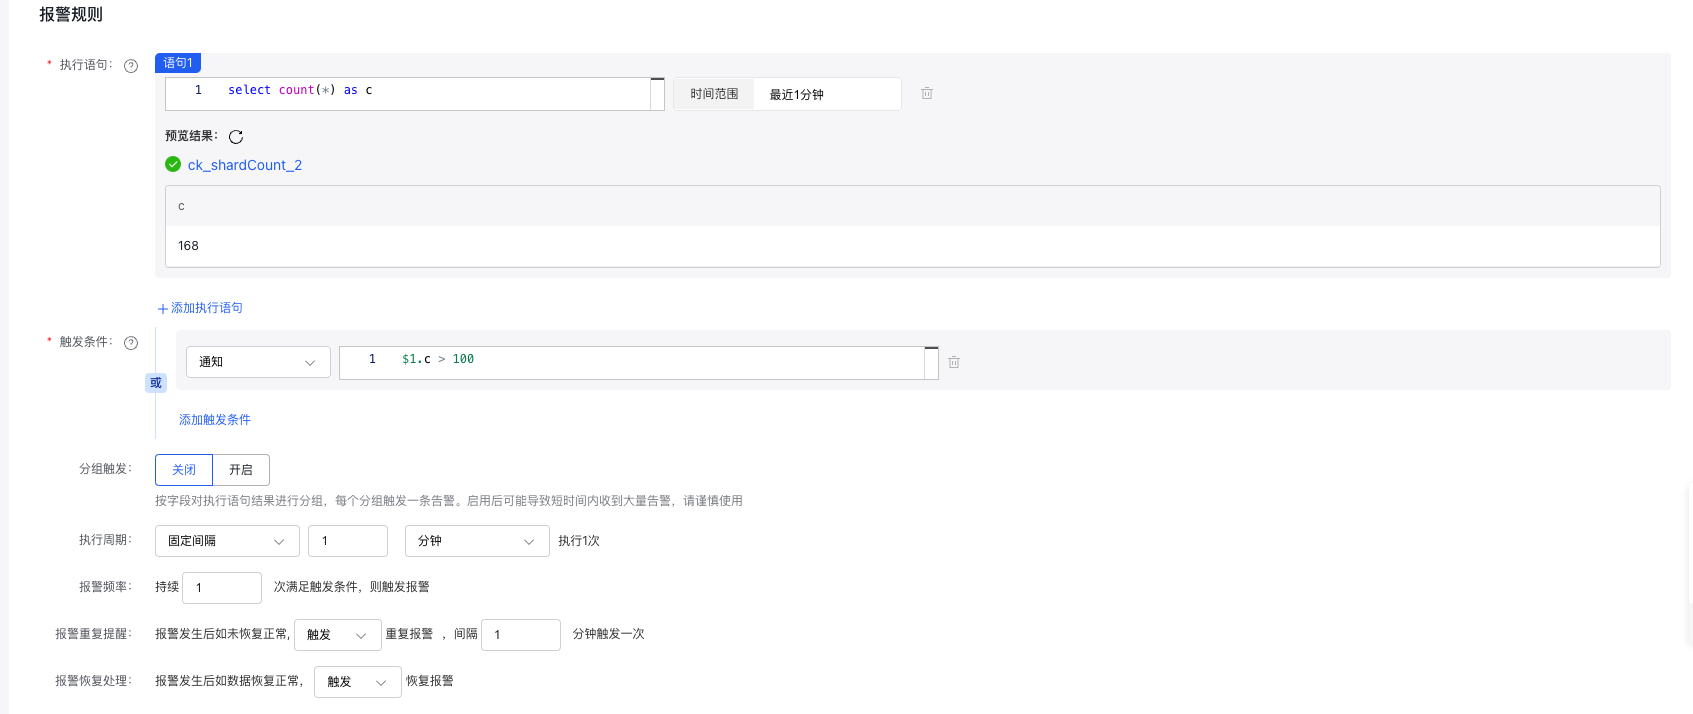
- Execution statement: Enter log search and analysis statements, and support the addition of multiple entries, 3 at most; support pure search statements
match ..., query statementsselect ..., and query statements with search conditionsmatch ...| select ... - Query time range: The time range specified for filtering logs in the query, with a maximum limit of logs from one day.
-
Trigger conditions: Alarms will be triggered when set conditions are met. There are three levels of alerts: notification, warning, and severe. Alarms corresponding to the respective levels will be triggered when their conditions are satisfied. Multiple alarms will trigger if multiple conditions are met at the same time.
- Trigger expression: For syntax rules, refer to Trigger condition expressions.
-
Group trigger: Enables group trigger functionality. When activated, if an execution statement results in multiple outcomes, these outcomes are grouped based on specified fields. Each group is assessed individually to determine whether it meets the alarm conditions; any group meeting the criteria will trigger an alarm independently.
- Grouping field: Choose fields from the results of the execution statement to use as grouping criteria. At least one field must be selected.
- When utilizing the group trigger function, a single alarm execution might generate a significant number of results that meet the trigger conditions, leading to numerous alarms (an alarm storm). Be sure to appropriately configure the group fields and trigger conditions.
-
Execution period: The frequency of monitoring task execution. The following two configuration methods are provided:
- Fixed frequency: Execute a monitor task once at a fixed interval (1 min - 24 h)
- Fixed time: Execute a monitor task once at a fixed time point. Time point range: 00:00 - 23:59
- Alarm frequency: Trigger an alarm when the condition is met consecutively for a specified number of times
- Repeated alarm: When an alarm is generated, support defining specific frequency and count for repeated notifications.
- Recovery alarm notification: Support triggering recovery alarm notification when the alarm is recovered
Configure dashboards
Add dashboard
- Select "Dashboard" from the left navigation bar to enter the Dashboard List page.
- Click on "Add Dashboard" at the top-left corner of the list, and provide a name for the dashboard in the pop-up window.
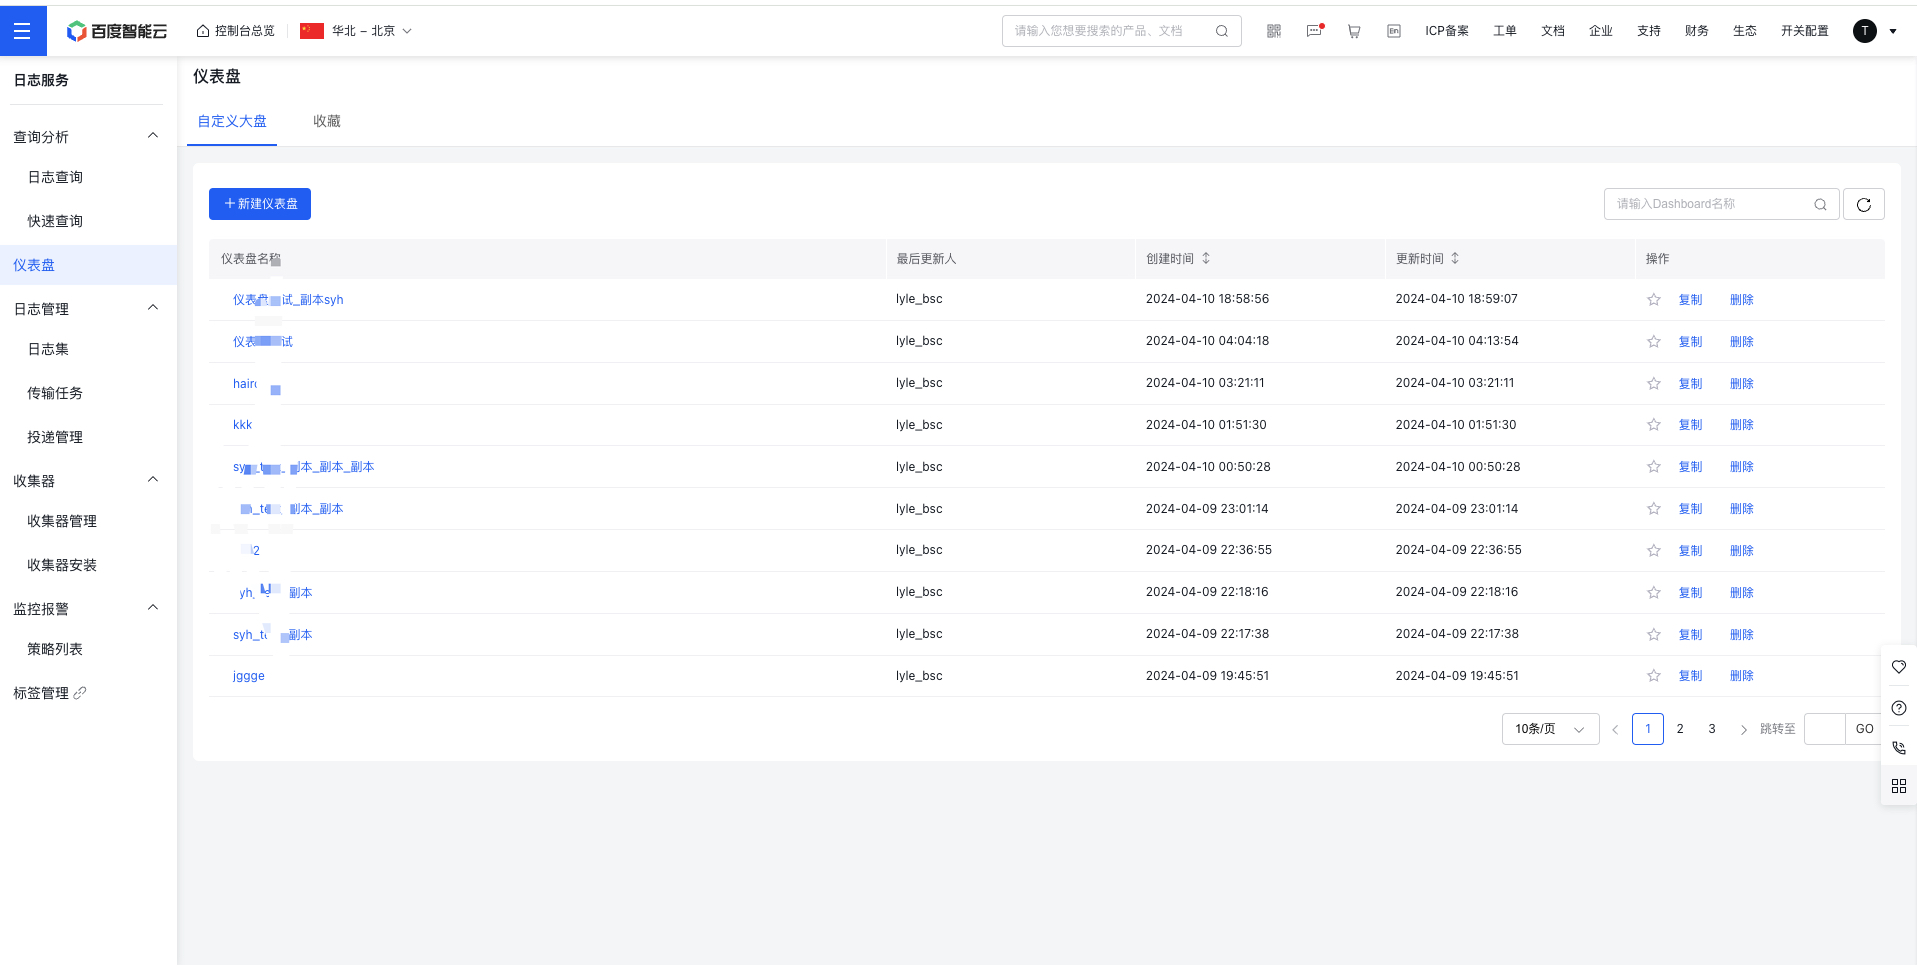
- Click "Confirm," and the dashboard will be successfully created.
View and configure dashboard
- Click Dashboard in the left navigation bar to access the Dashboard List page where you can view and configure the dashboard
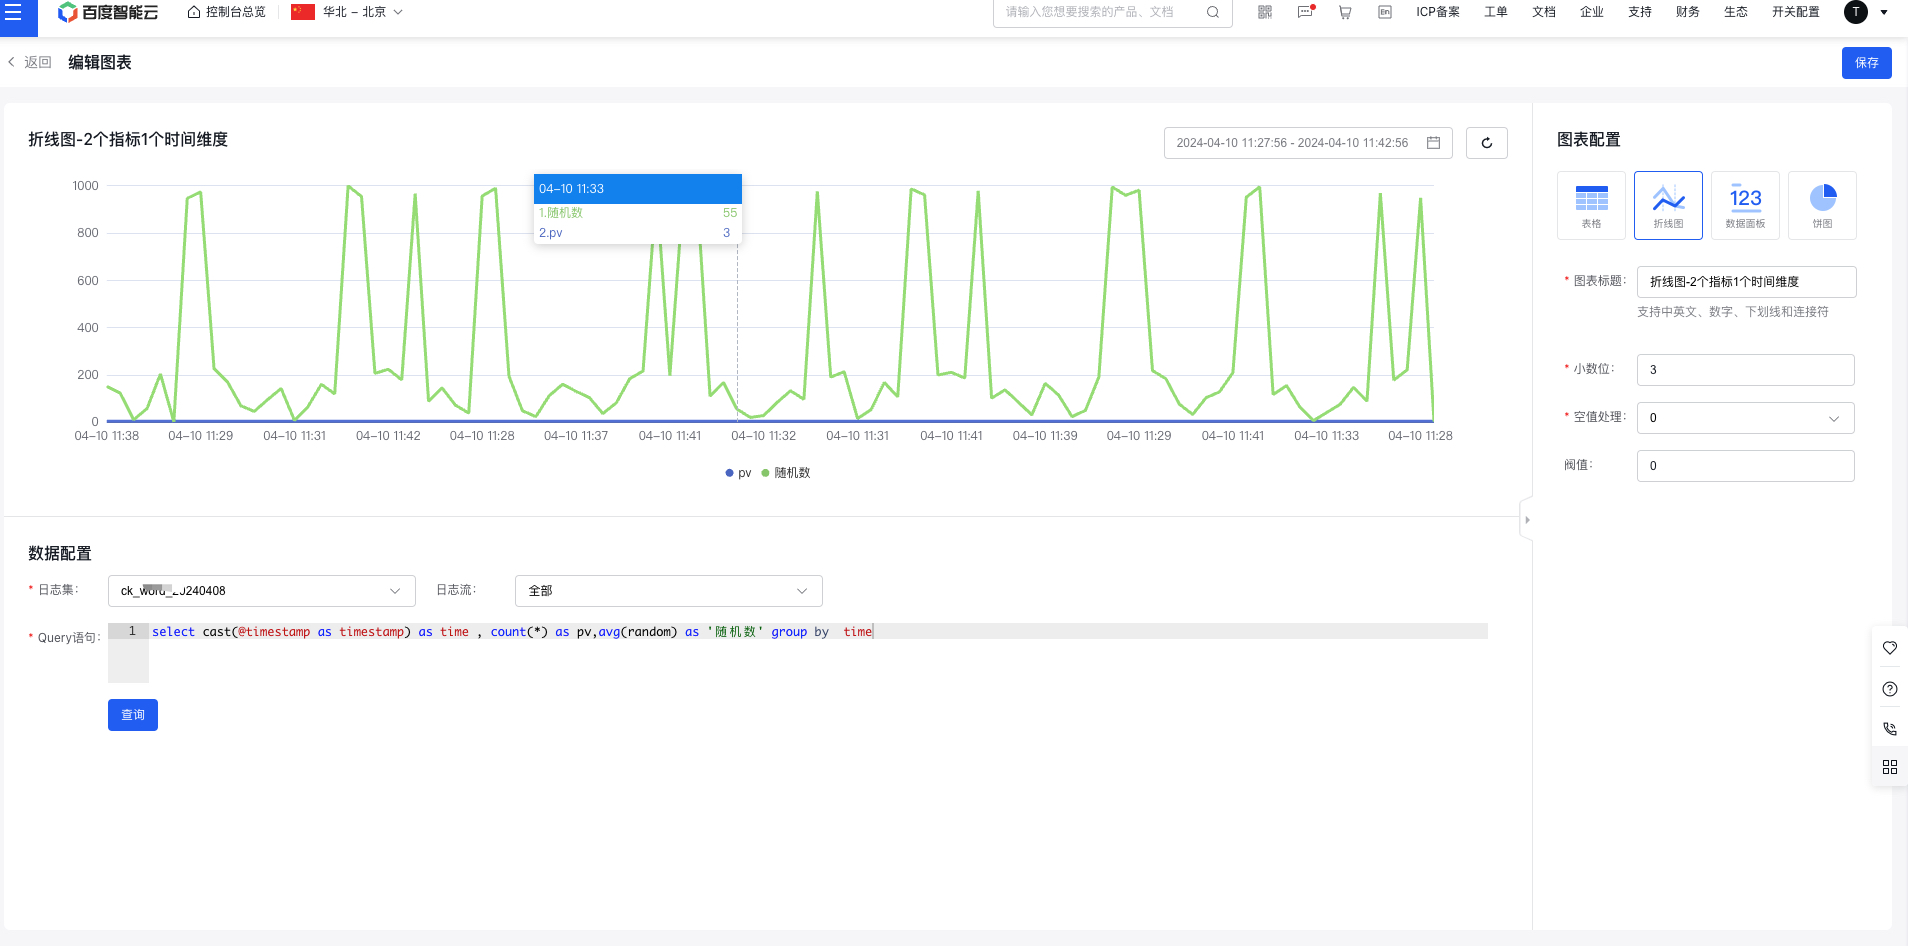
- Click the dashboard name to enter the dashboard details page, and click Chart to enter the chart configuration page.
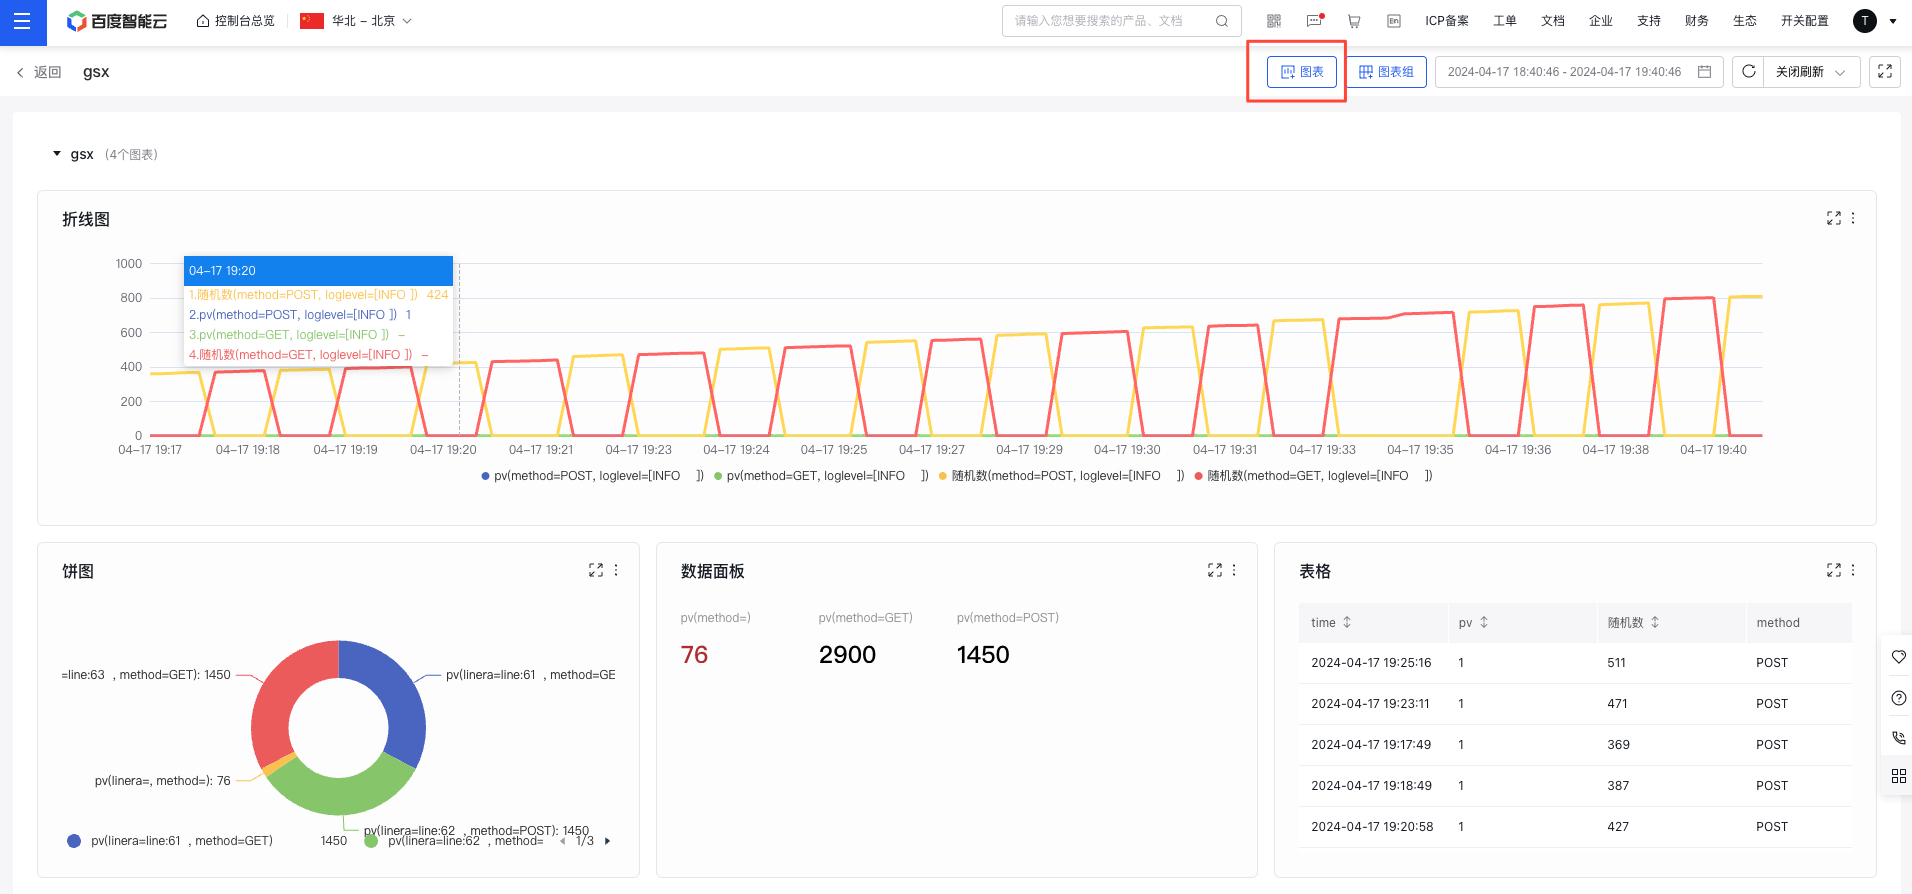
- Select a logstore, configure the query statement (refer to sql syntax), and select the chart type on the right to complete the chart configuration, and then return to the Dashboard details page.