工作卡图表使用说明
更新时间:2024-07-29
工作卡-图表使用说明
用户可以在工作卡搭建平台使用图表控件来将数据以图表的方式进行展示。图表渲染采用Echart渲染规则 https://echarts.apache.org/handbook/zh/get-started/

用户将图表组件拖拽到工作卡上之后可以通过设置动态变量的方式为工作卡填充数据

注意,图表组件支持的动态变量类型目前只能是嵌套数组,且循环元素的结构需要按照要求进行命名

用户可以通过mock数据来预览图表效果

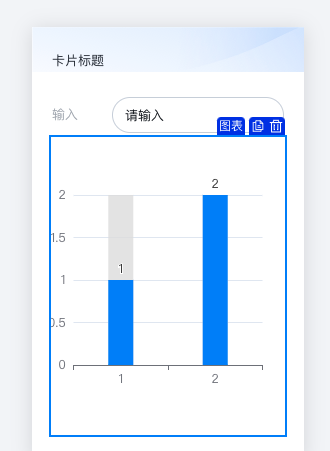
如果使用复杂样式,请使用option进行样式扩展,如下:
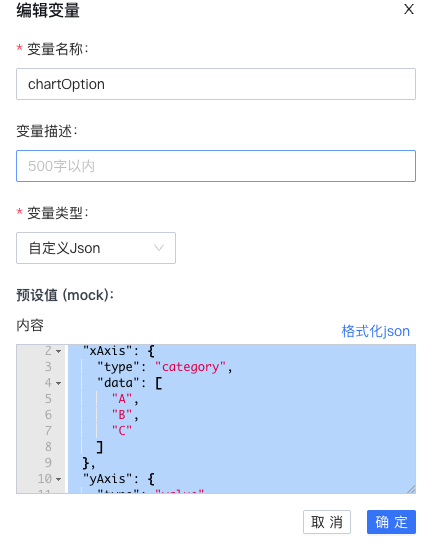
Plain Text
1{
2  "xAxis": {
3    "type": "category",
4    "data": [
5      "A",
6      "B",
7      "C"
8    ]
9  },
10  "yAxis": {
11    "type": "value"
12  },
13  "series": [
14    {
15      "data": [
16        120,
17        200,
18        150
19      ],
20      "type": "line"
21    }
22  ]
23}
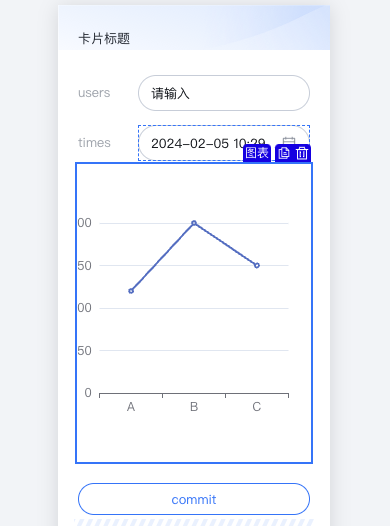
展示效果如下:
更多复杂的图表样式见下列描述
1.柱状图
Plain Text
1option = {
2  xAxis: {
3    data: ['Mon', 'Tue', 'Wed', 'Thu', 'Fri', 'Sat', 'Sun']
4  },
5  yAxis: {},
6  series: [
7    {
8      type: 'bar',
9      data: [23, 24, 18, 25, 27, 28, 25]
10    }
11  ]
12};
13// 多系列的柱状图
14option = {
15  xAxis: {
16    data: ['Mon', 'Tue', 'Wed', 'Thu', 'Fri', 'Sat', 'Sun']
17  },
18  yAxis: {},
19  series: [
20    {
21      type: 'bar',
22      data: [23, 24, 18, 25, 27, 28, 25]
23    },
24    {
25      type: 'bar',
26      data: [26, 24, 18, 22, 23, 20, 27]
27    }
28  ]
29};
30// 柱状图样式设置
31option = {
32  xAxis: {
33    data: ['A', 'B', 'C', 'D', 'E']
34  },
35  yAxis: {},
36  series: [
37    {
38      type: 'bar',
39      data: [
40        10,
41        22,
42        28,
43        {
44          value: 43,
45          // 设置单个柱子的样式
46          itemStyle: {
47            color: '#91cc75',
48            shadowColor: '#91cc75',
49            borderType: 'dashed',
50            opacity: 0.5
51          }
52        },
53        49
54      ],
55      itemStyle: {
56        barBorderRadius: 5,
57        borderWidth: 1,
58        borderType: 'solid',
59        borderColor: '#73c0de',
60        shadowColor: '#5470c6',
61        shadowBlur: 3
62      }
63    }
64  ]
65};
66// 堆叠柱状图
67option = {
68  xAxis: {
69    data: ['A', 'B', 'C', 'D', 'E']
70  },
71  yAxis: {},
72  series: [
73    {
74      data: [10, 22, 28, 43, 49],
75      type: 'bar',
76      stack: 'x'
77    },
78    {
79      data: [5, 4, 3, 5, 10],
80      type: 'bar',
81      stack: 'x'
82    }
83  ]
84};
85// 柱条添加背景色
86option = {
87  xAxis: {
88    type: 'category',
89    data: ['Mon', 'Tue', 'Wed', 'Thu', 'Fri', 'Sat', 'Sun']
90  },
91  yAxis: {
92    type: 'value'
93  },
94  series: [
95    {
96      data: [120, 200, 150, 80, 70, 110, 130],
97      type: 'bar',
98      showBackground: true,
99      backgroundStyle: {
100        color: 'rgba(220, 220, 220, 0.8)'
101      }
102    }
103  ]
104};| 功能 | 效果 |
|---|---|
| 基础柱状图 |  |
| 多系列的柱状图 |  |
| 柱状图样式设置 |  |
| 堆叠柱状图 |  |
| 柱条添加背景色 |  |
2.折线图
Plain Text
1// 基础折线图
2option = {
3  xAxis: {
4    type: 'category',
5    data: ['A', 'B', 'C']
6  },
7  yAxis: {
8    type: 'value'
9  },
10  series: [
11    {
12      data: [120, 200, 150],
13      type: 'line'
14    }
15  ]
16};
17// 笛卡尔坐标系中的折线图
18option = {
19  xAxis: {},
20  yAxis: {},
21  series: [
22    {
23      data: [
24        [20, 120],
25        [50, 200],
26        [40, 50]
27      ],
28      type: 'line'
29    }
30  ]
31};
32// 折线图样式设置
33option = {
34  xAxis: {
35    data: ['A', 'B', 'C', 'D', 'E']
36  },
37  yAxis: {},
38  series: [
39    {
40      data: [10, 22, 28, 23, 19],
41      type: 'line',
42      lineStyle: {
43        normal: {
44          color: 'green',
45          width: 4,
46          type: 'dashed'
47        }
48      }
49    }
50  ]
51};
52// 在数据点处显示数值
53option = {
54  xAxis: {
55    data: ['A', 'B', 'C', 'D', 'E']
56  },
57  yAxis: {},
58  series: [
59    {
60      data: [10, 22, 28, 23, 19],
61      type: 'line',
62      label: {
63        show: true,
64        position: 'bottom',
65        textStyle: {
66          fontSize: 20
67        }
68      }
69    }
70  ]
71}
72// 空数据
73option = {
74  xAxis: {
75    data: ['A', 'B', 'C', 'D', 'E']
76  },
77  yAxis: {},
78  series: [
79    {
80      data: [0, 22, '-', 23, 19],
81      type: 'line'
82    }
83  ]
84};
85// 堆叠折线图加背景
86option = {
87  xAxis: {
88    data: ['A', 'B', 'C', 'D', 'E']
89  },
90  yAxis: {},
91  series: [
92    {
93      data: [10, 22, 28, 43, 49],
94      type: 'line',
95      stack: 'x',
96      areaStyle: {}
97    },
98    {
99      data: [5, 4, 3, 5, 10],
100      type: 'line',
101      stack: 'x',
102      areaStyle: {}
103    }
104  ]
105};
106// 区域面积图
107option = {
108  xAxis: {
109    data: ['A', 'B', 'C', 'D', 'E']
110  },
111  yAxis: {},
112  series: [
113    {
114      data: [10, 22, 28, 23, 19],
115      type: 'line',
116      areaStyle: {}
117    },
118    {
119      data: [25, 14, 23, 35, 10],
120      type: 'line',
121      areaStyle: {
122        color: '#ff0',
123        opacity: 0.5
124      }
125    }
126  ]
127};
128// 平滑曲线图
129option = {
130  xAxis: {
131    data: ['A', 'B', 'C', 'D', 'E']
132  },
133  yAxis: {},
134  series: [
135    {
136      data: [10, 22, 28, 23, 19],
137      type: 'line',
138      smooth: true
139    }
140  ]
141};
142// 阶梯线图
143option = {
144  xAxis: {
145    type: 'category',
146    data: ['Mon', 'Tue', 'Wed', 'Thu', 'Fri', 'Sat', 'Sun']
147  },
148  yAxis: {
149    type: 'value'
150  },
151  series: [
152    {
153      name: 'Step Start',
154      type: 'line',
155      step: 'start',
156      data: [120, 132, 101, 134, 90, 230, 210]
157    },
158    {
159      name: 'Step Middle',
160      type: 'line',
161      step: 'middle',
162      data: [220, 282, 201, 234, 290, 430, 410]
163    },
164    {
165      name: 'Step End',
166      type: 'line',
167      step: 'end',
168      data: [450, 432, 401, 454, 590, 530, 510]
169    }
170  ]
171};| 功能 | 效果 |
|---|---|
| 基础折线图 |  |
| 笛卡尔坐标系中的折线图 |  |
| 折线图样式设置 |  |
| 在数据点处显示数值 |  |
| 空数据 |  |
| 堆叠折线图加背景 |  |
| 区域面积图 |  |
| 平滑曲线图 |  |
| 阶梯线图 |  |
