Create Database
TSDB is a specialized database for managing time series data. Different from the traditional relational database, TSDB is specifically optimized for the storage, query and display of the time series data, so that high data compression capabilities and excellent query performance are achieved. Therefore, TSDB is especially suitable for IoT application scenarios.
- Log in to https://cloud.baidu.com, click Management Console in the upper right corner, to quickly enter the console interface.
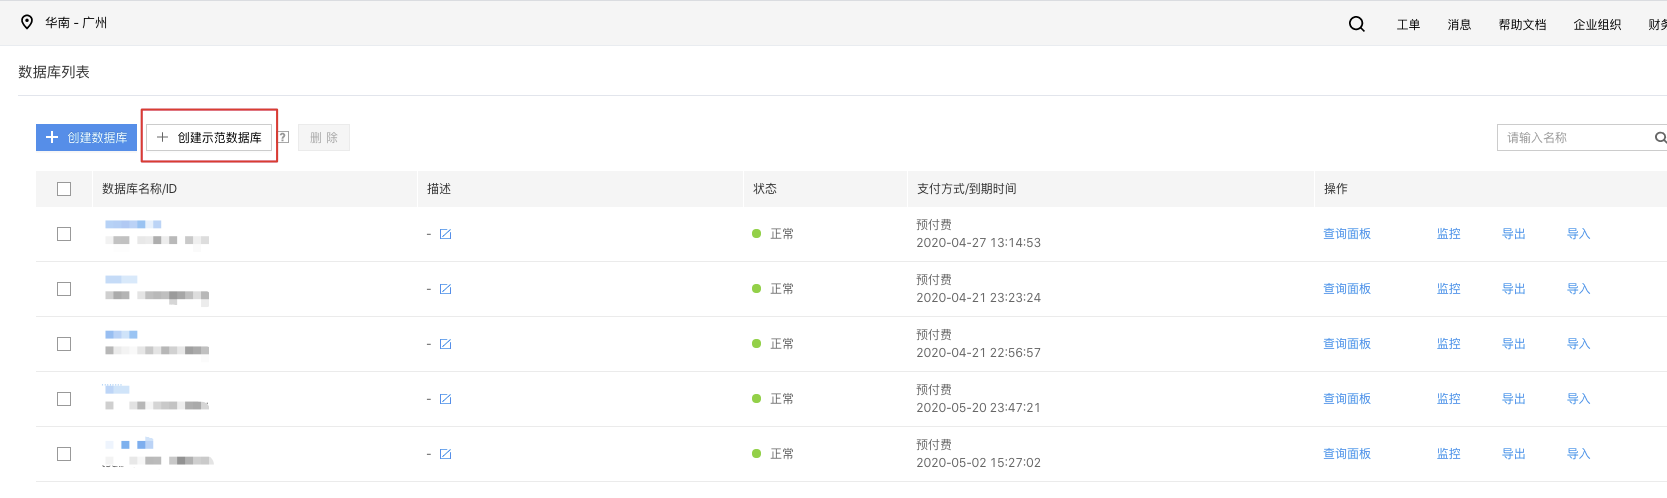
- Select Product Service > Time Series Database TSDB, and enter the Database List page.
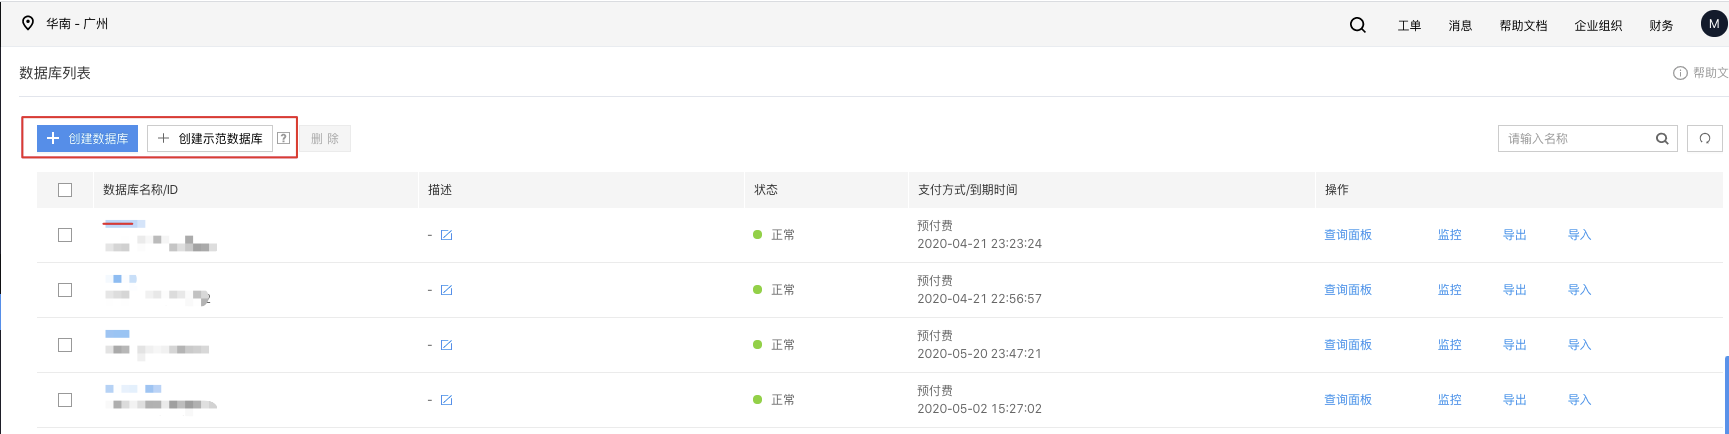
- Click Create Database to enter the Create Database page, and enter configuration information, including:
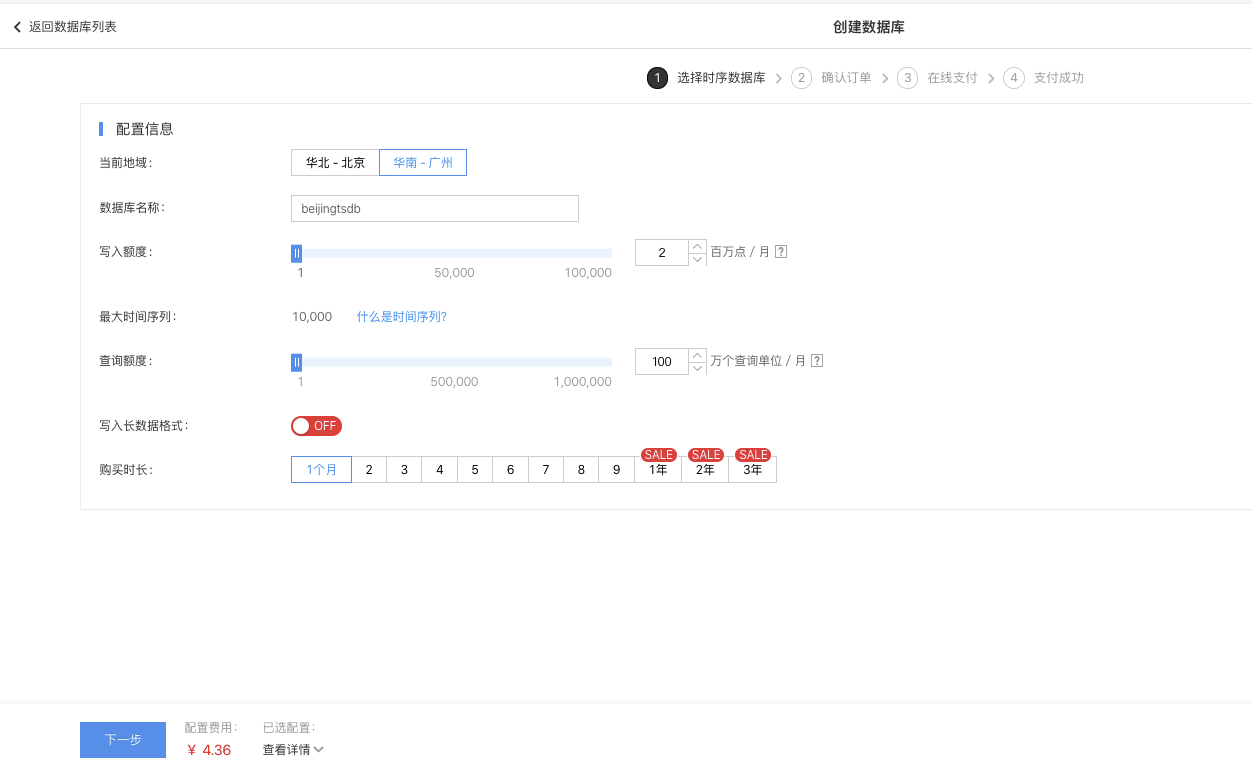
- Click Confirm Order when the configuration is done, to complete the creation of the TSDB database.
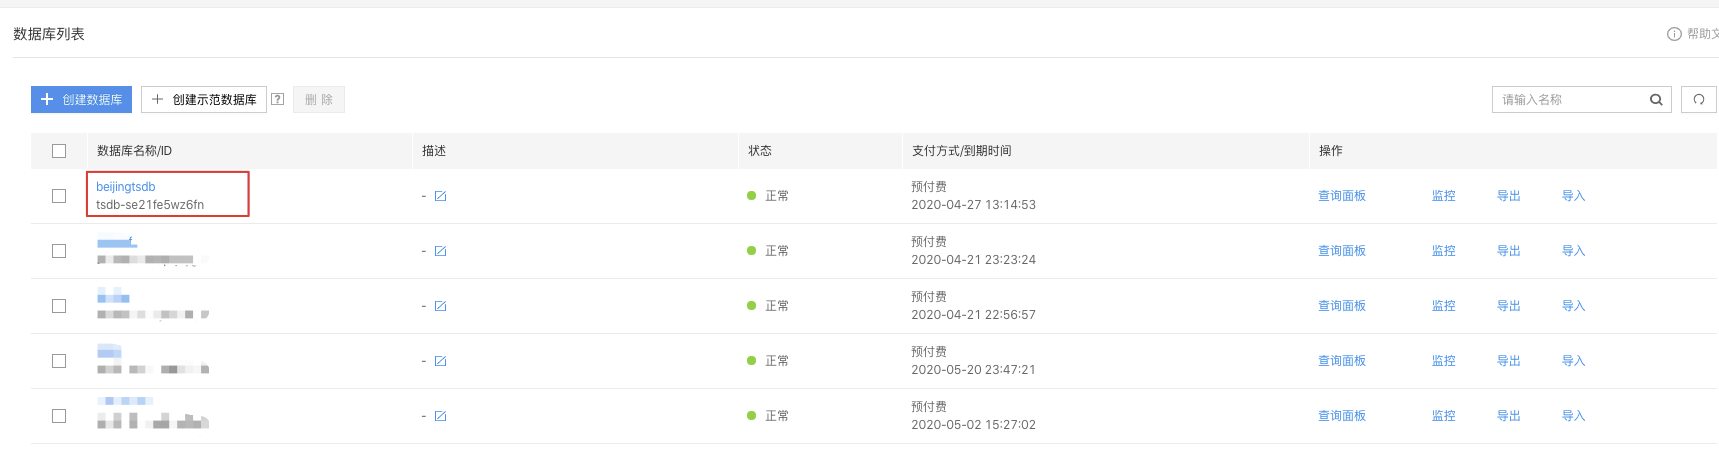
- Return to Database List page
Create Demonstration Database
The demonstration database helps users experience various functions of the time series data. The functions and creation method of the demonstration database are the same as that of the normal TSDB. Once created successfully, the system automatically imports weather data into the demonstration database.
The demonstration database contains meteorological simulation data (non-real data) such as temperature, humidity, wind force, PM2.5, and ultraviolet index collected at 8 a.m. each day on air monitoring stations in Beijing, Shanghai and Guangzhou in 2015, the names and zip codes of each city to which each data point belongs, the monitoring station's geographical location (latitude and longitude) and other tags, to help you quickly experience and understand various functions of query, aggregation and chart display of the TSDB.
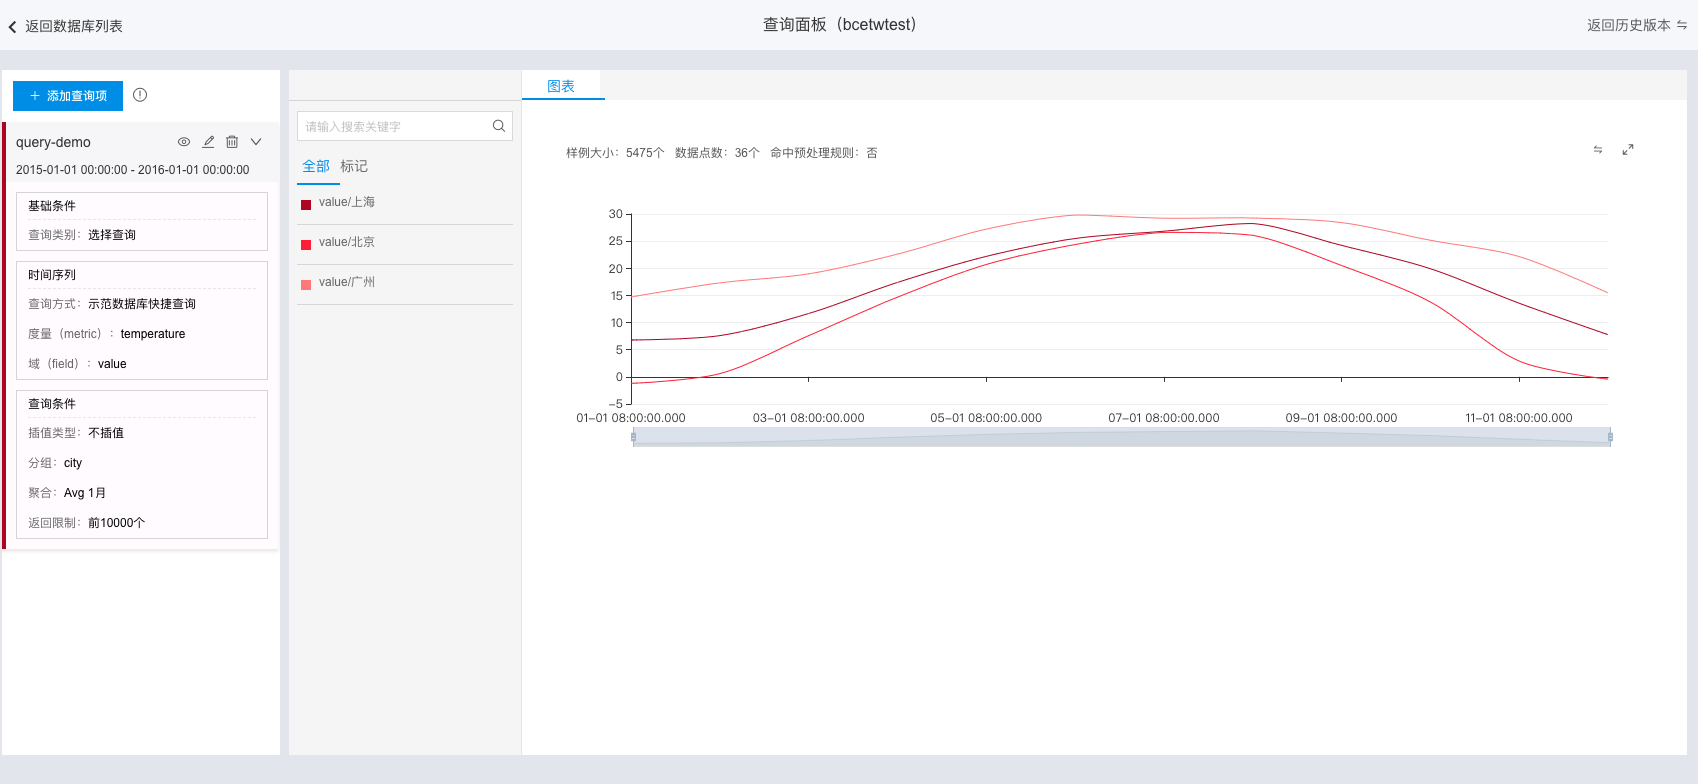
Generate Demonstration Database Chart
For a specific introduction to the function of generating charts by using TSDB, see Generate Charts Through Query Panel. The following is a simple example of charts generated by the demonstration database.
View Weather Changes in Beijing, Shanghai and Guangzhou in 2015
Note:
The horizontal axis in the generated chart indicates the value of the timestamp field written to the data point.
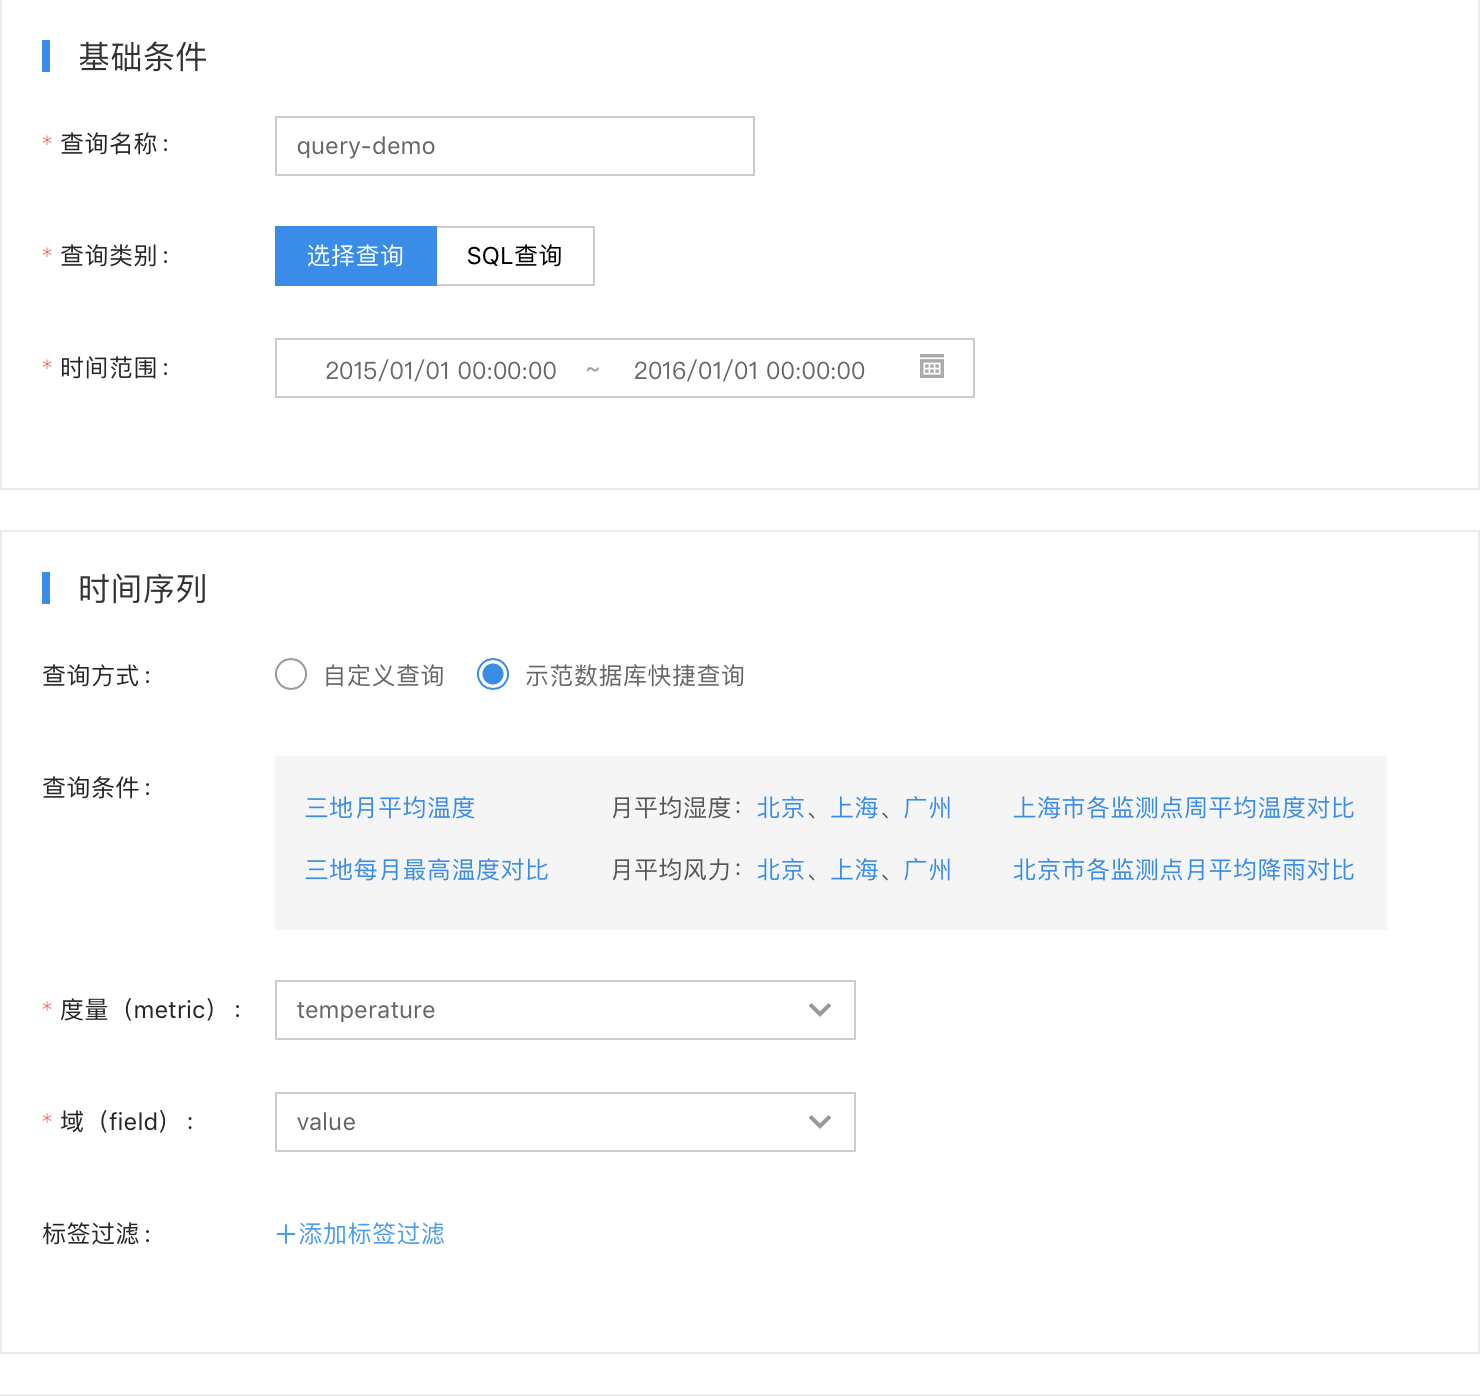
Add Query Items in Query Panel

Parameters Setup of Query Items
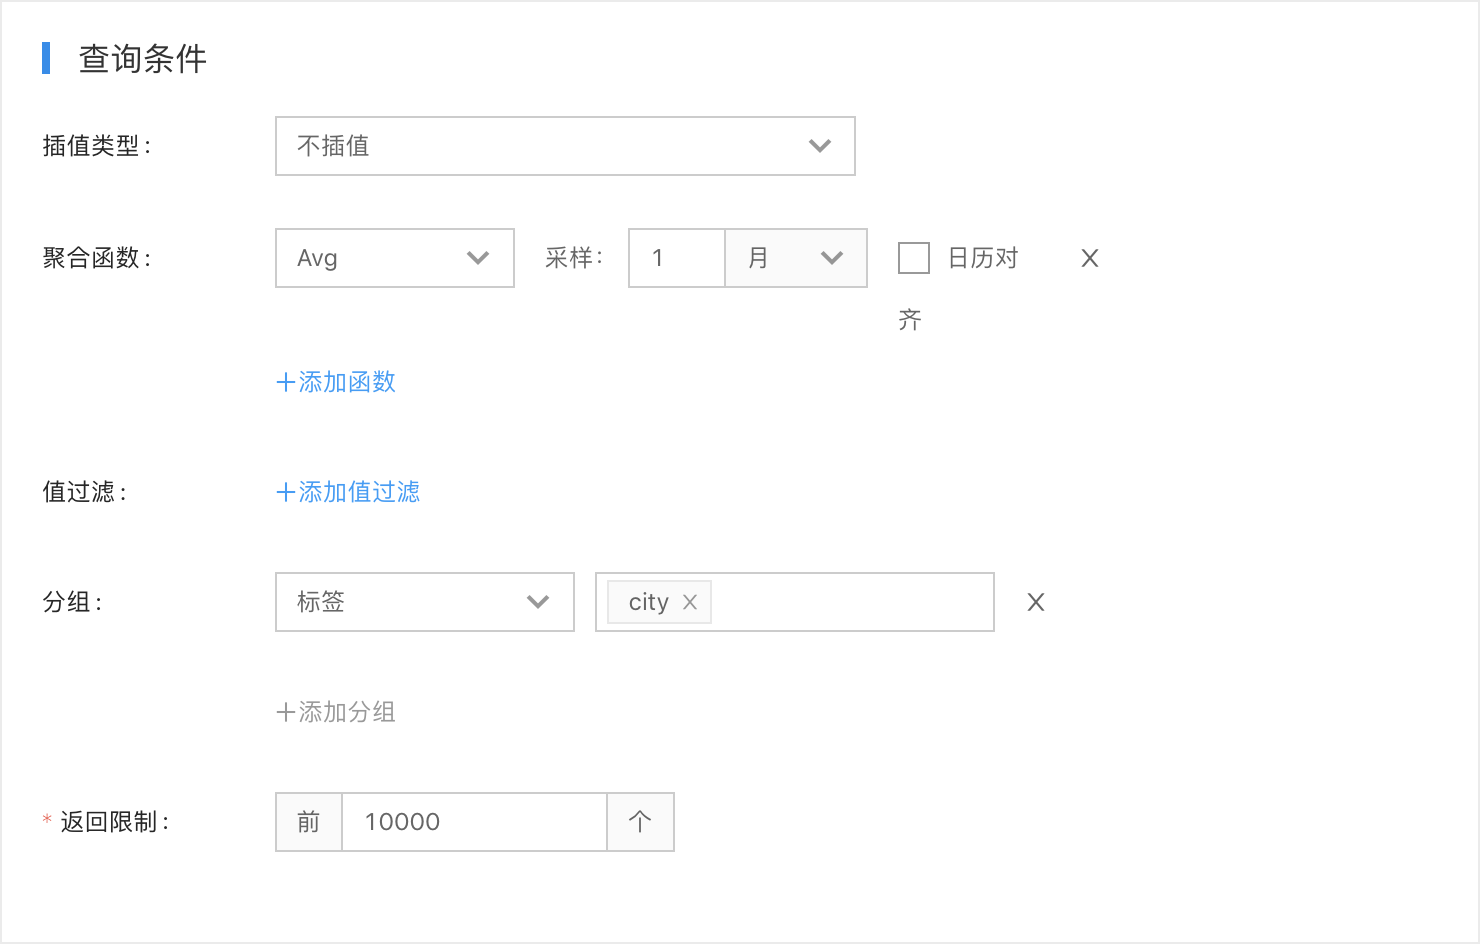
Generate Chart