
对接Cprom实现监控告警
更新时间:2026-04-21
概述
本文档介绍如何将服务网格 CSM 对接 Prometheus 监控服务 CProm,实现服务网格指标的监控、告警配置和大盘展示。通过完成本文档中的操作,您可以分别为托管网格开启控制面指标监控,为独立网格开启数据面指标监控,并进入 Grafana 和 CProm 页面完成后续查看与告警配置。
前提条件
- 已创建 与 Kubernetes 集群同地域的 CProm 实例,详情请参考: 创建CProm实例。
- 对于已运行工作负载的 Kubernetes 集群,需要安装 CProm 采集 Agent 用于采集指标,详情请参考: Agent管理。
注意: 托管服务网格暂不支持数据面监控告警。
操作步骤
托管网格
开启控制面指标监控
导航路径: 产品服务->云计算->容器->服务网格 CSM->网格列表->目标托管网格实例->可观测管理->Prometheus 监控
注意: 被服务网格实例纳管的 CCE 集群,需要安装 CProm 采集 Agent,否则无法选择相关的 CProm 实例。
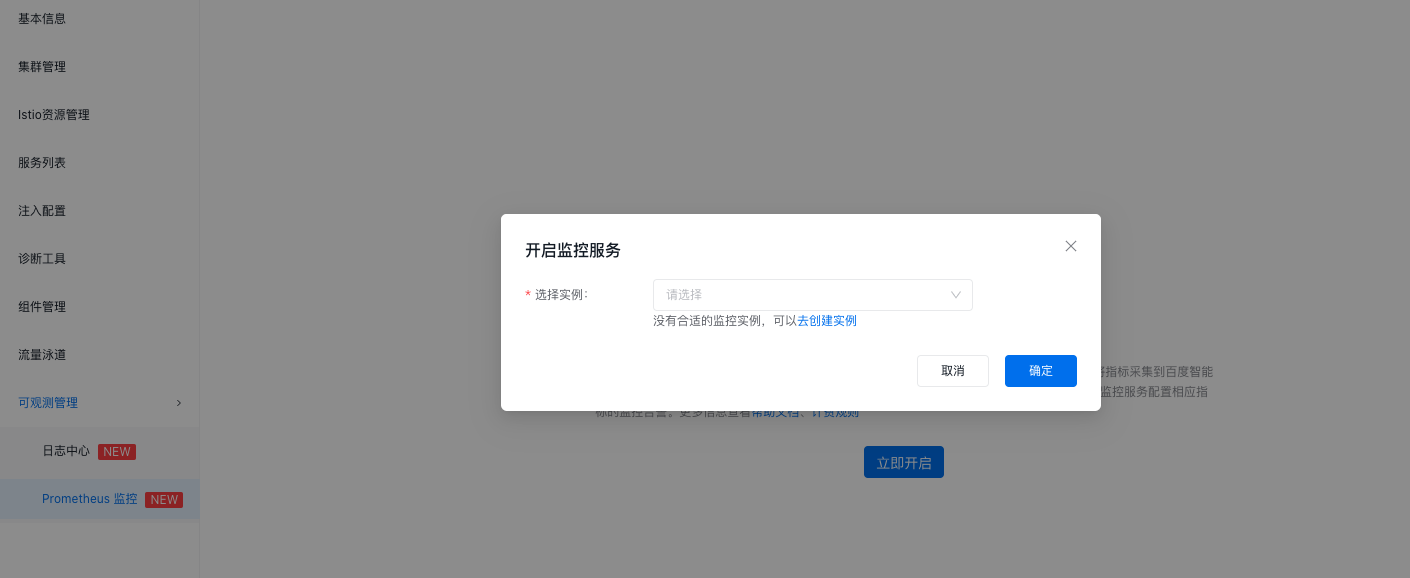
- 登录 百度智能云控制台,进入 服务网格 CSM->网格列表 页面后,单击目标托管网格实例名称,进入实例详情页。在实例详情页选择 【可观测管理】 下的 【Prometheus 监控】,进入控制面监控页面。
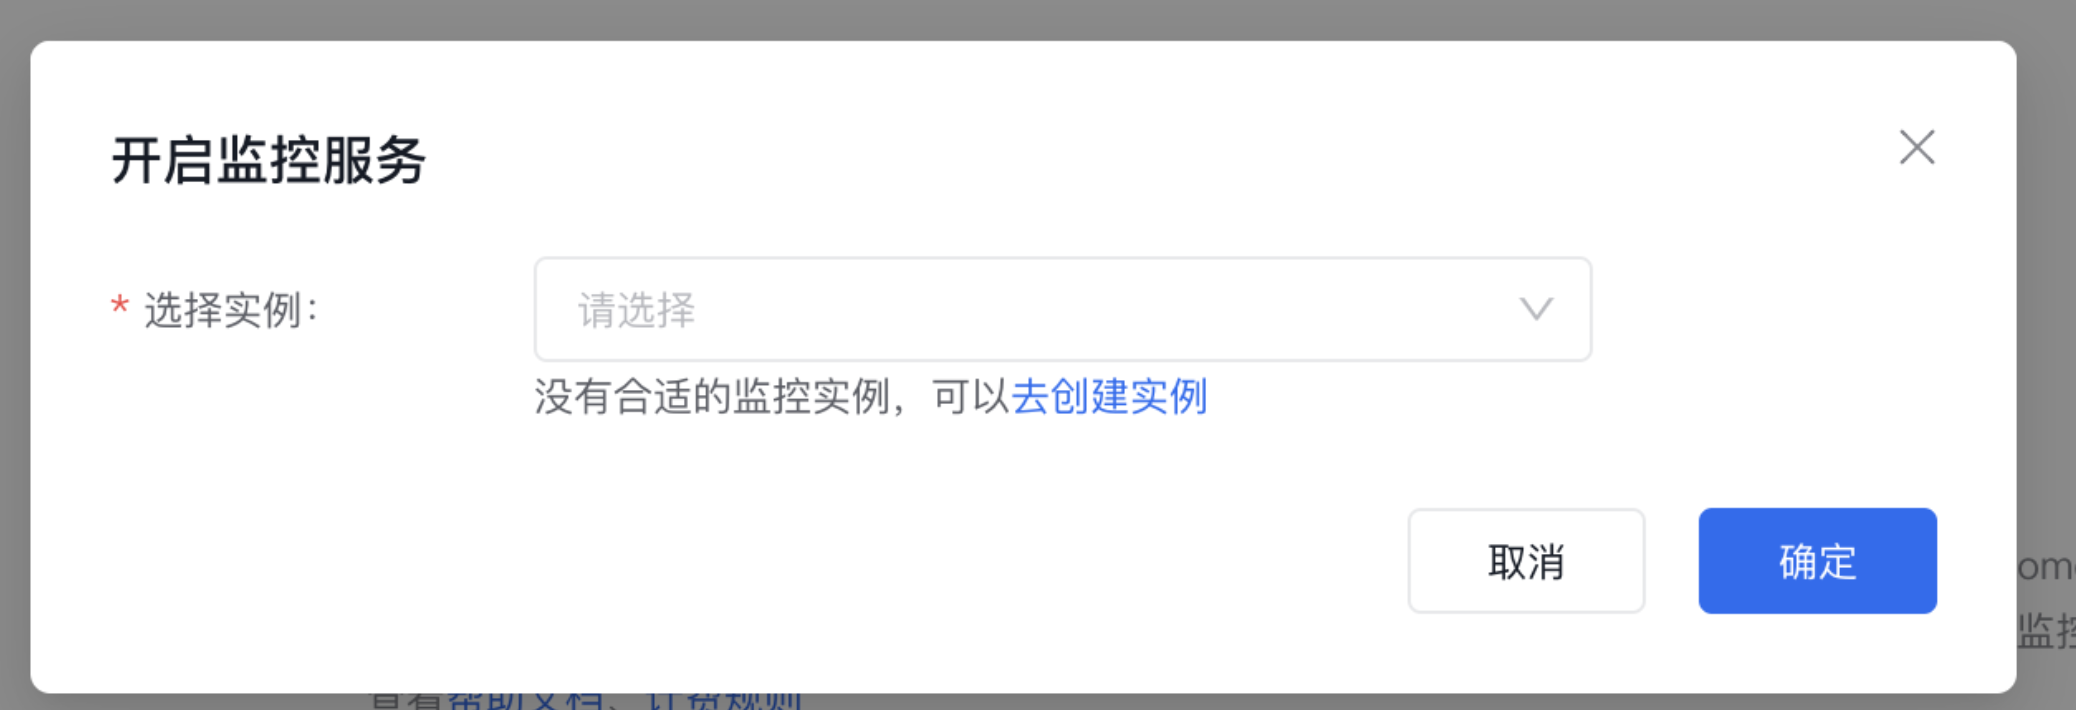
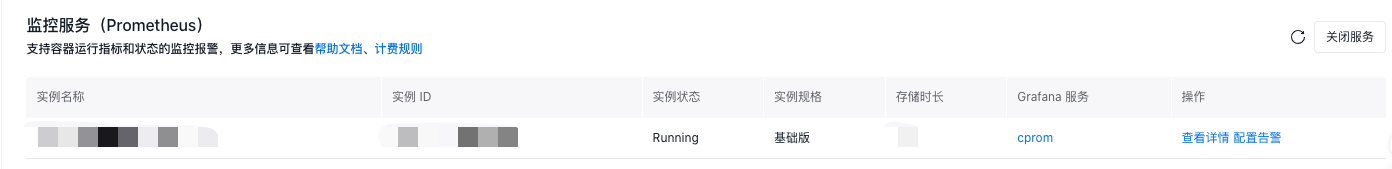
- 在控制面监控页面单击 【立即开启】。在 开启监控服务 弹窗中,选择需要绑定的 CProm 实例,然后单击 【确定】。开启完成后,页面会展示已绑定的 CProm 实例信息,并提供 【查看详情】、【配置告警】 等操作入口,表示控制面指标监控已成功开启。

配置控制面指标监控
导航路径: 产品服务->云计算->容器->服务网格 CSM->网格列表->目标托管网格实例->可观测管理->Prometheus 监控
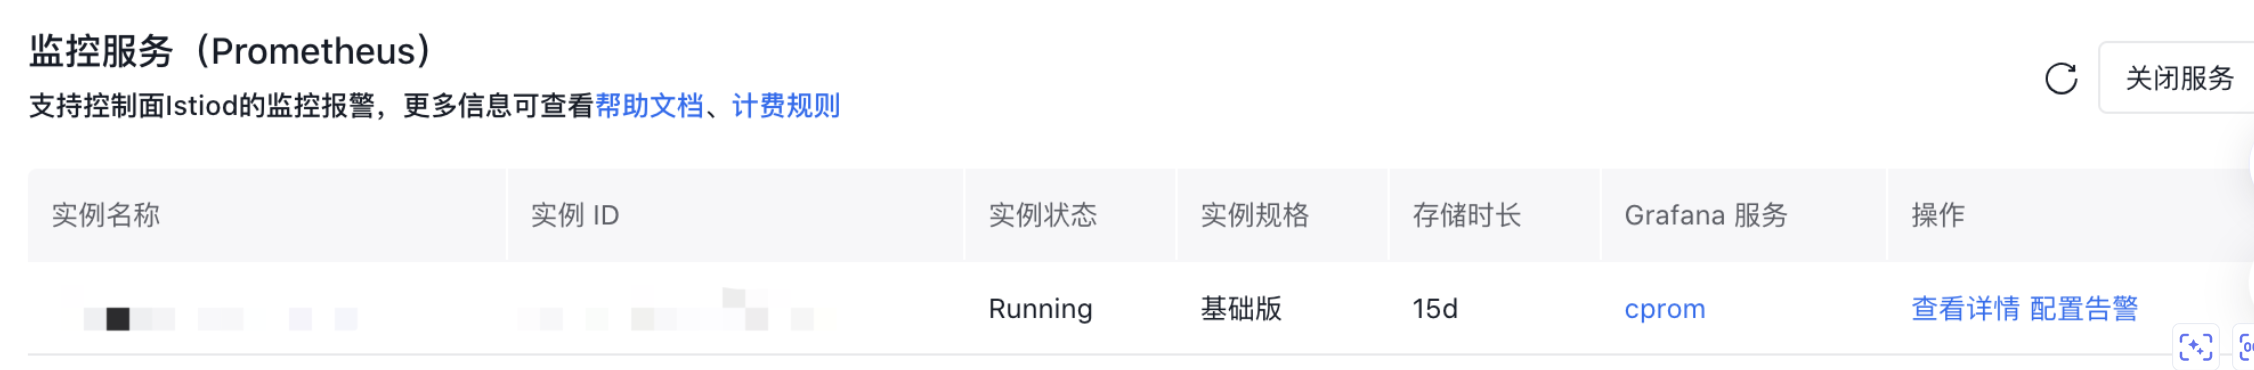
- 进入目标托管网格实例的 【Prometheus 监控】 页面。页面会展示当前已关联的 CProm 实例,并提供 【Grafana 服务】、【查看详情】、【配置告警】 等操作入口。若页面提示未安装采集 Agent,请先参考 Agent管理 完成安装。

控制面监控指标
| 指标名称 | 类型 | 描述 |
|---|---|---|
endpoint_no_pod |
LastValue | 没有关联 Pod 的端点 |
pilot_endpoint_not_ready |
LastValue | 发现处于未就绪状态的端点 |
pilot_destrule_subsets |
LastValue | 相同主机目的地规则的重复子集 |
pilot_duplicate_envoy_clusters |
LastValue | 由具有相同主机名的服务条目引起的重复 Envoy 集群 |
pilot_no_ip |
LastValue | 在端点表中找不到 Pod,可能无效 |
pilot_eds_no_instances |
LastValue | 没有实例的集群数量 |
pilot_vservice_dup_domain |
LastValue | 具有重复域的虚拟服务数量 |
citadel_server_root_cert_expiry_timestamp |
LastValue | Citadel 根证书过期的 Unix 时间戳(秒),负时间表示证书已过期 |
galley_validation_failed |
Sum | 资源验证失败总数 |
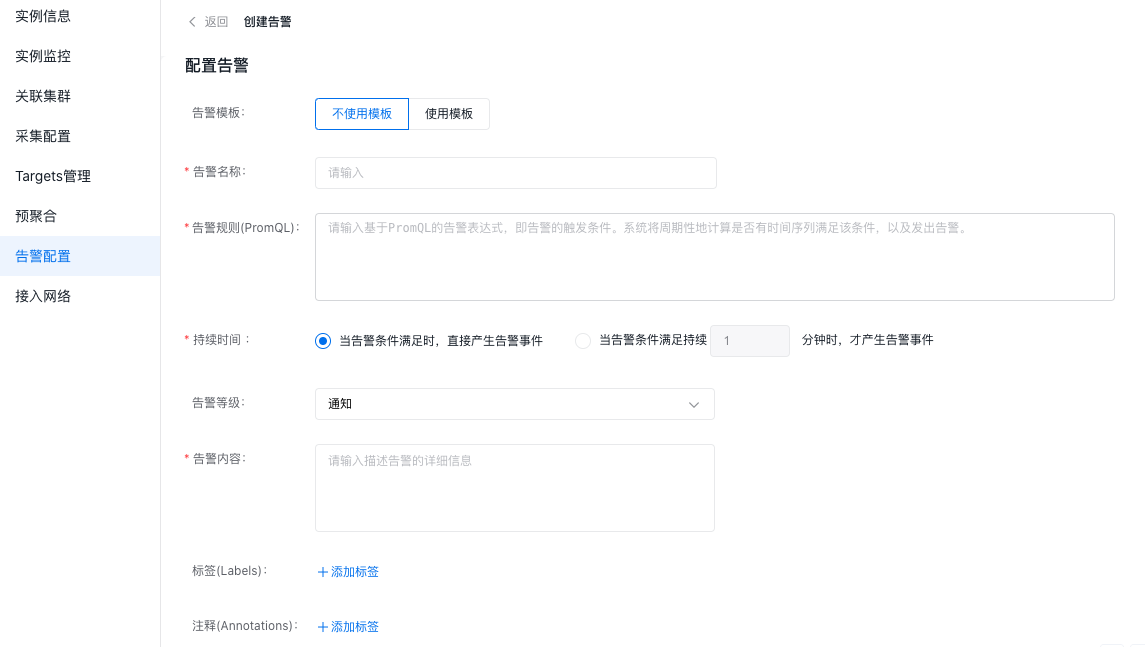
控制面告警配置参考
YAML
1# Pilot
2- alert: IstioPilotPodNotInEndpointTable
3  annotations:
4    summary: "Pilot pods not found in the endpoint table"
5    description: "Pods not found in the endpoint table, possibly invalid"
6  expr: >
7    pilot_no_ip > 0
8
9- alert: IstioPilotEndpointNotReady
10  annotations:
11    summary: "Pilot endpoint found in unready state"
12    description: "Pilot endpoint found in unready state for 30 second"
13  expr: >
14    pilot_endpoint_not_ready > 0
15  for: 30s
16
17- alert: IstioPilotDestruleSubsetsException
18  annotations:
19    summary: "Pilot pilot_destrule_subsets is greater than 0"
20    description: "pilot_destrule_subsets Duplicate subsets across destination rules for same host"
21  expr: >
22    pilot_destrule_subsets > 0
23
24- alert: IstioPilotDuplicateEnvoyClustersException
25  annotations:
26    summary: "Pilot pilot_duplicate_envoy_clusters is greater than 0"
27    description: "pilot_duplicate_envoy_clusters Duplicate envoy clusters caused by service entries with same hostname"
28  expr: >
29    pilot_duplicate_envoy_clusters > 0
30
31- alert: IstioPilotDuplicateEntry
32  expr: >
33    sum(rate(pilot_duplicate_envoy_clusters{}[1m])) > 0
34  for: 1m
35  labels:
36    severity: critical
37  annotations:
38    summary: Istio Pilot Duplicate Entry on clusterID {{ $labels.clusterID }} and region {{ $labels.region }}
39    description: "Istio pilot duplicate entry error.\nVALUE = {{ $value }}\nLABELS = {{ $labels }}"
40
41- alert: IstioPilotEndpointNoPodException
42  annotations:
43    summary: "Pilot endpoint_no_pod is greater than 0"
44    description: "endpoint_no_pod Endpoints without an associated pod"
45  expr: >
46    endpoint_no_pod > 0
47
48- alert: IstioPilotEdsNoInstancesException
49  annotations:
50    summary: "Pilot pilot_eds_no_instances is greater than 0"
51    description: "pilot_eds_no_instances Number of clusters without instances"
52  expr: >
53    pilot_eds_no_instances > 0
54
55- alert: IstioPilotVserviceDupDomainException
56  annotations:
57    summary: "Pilot pilot_vservice_dup_domain is greater than 0"
58    description: "pilot_vservice_dup_domain Virtual services with dup domains"
59  expr: >
60    pilot_vservice_dup_domain > 0
61
62# CITADEL
63- alert: IstioCitadelRootCertError
64  annotations:
65    summary: "Citadel root certificate internal error occured"
66    description: "Citadel root certificate internal error occured on clusterID {{ $labels.clusterID }} and region {{ $labels.region }}"
67  expr: >
68    citadel_server_root_cert_expiry_timestamp < 0
69
70- alert: IstioCitadelCertIssuanceFailure
71  annotations:
72    summary: "Citadel certificate issuance failed"
73    description: "Citadel certificate issuance failed in last 1 minutes"
74  expr: >
75    (citadel_server_csr_count - citadel_server_success_cert_issuance_count) >
76    (citadel_server_csr_count offset 1m - citadel_server_success_cert_issuance_count offset 1m)
77
78- alert: IstioCitadelCsrSignError
79  annotations:
80    summary: "Citadel CSR signing error"
81    description: "Citadel CSR signing error occured in last 1 minutes on clusterID {{ $labels.clusterID }} and region {{ $labels.region }}"
82  expr: >
83    (absent(citadel_server_csr_sign_err_count offset 1m) == 1 and citadel_server_csr_sign_err_count > 0) or
84    (citadel_server_csr_sign_err_count - citadel_server_csr_sign_err_count offset 1m > 0)
85
86# GALLEY
87- alert: IstioGalleyValidationFailed
88  annotations:
89    summary: "Galley validation failed"
90    description: "Galley validation failed in last 1 minutes"
91  expr: >
92    (absent(galley_validation_failed offset 1m) == 1 and galley_validation_failed > 0) or
93    (galley_validation_failed - galley_validation_failed offset 1m > 0)
独立网格
开启数据面指标监控
注意: 被服务网格实例纳管的 CCE 集群,需要安装 CProm 采集 Agent,否则无法选择相关的 CProm 实例。
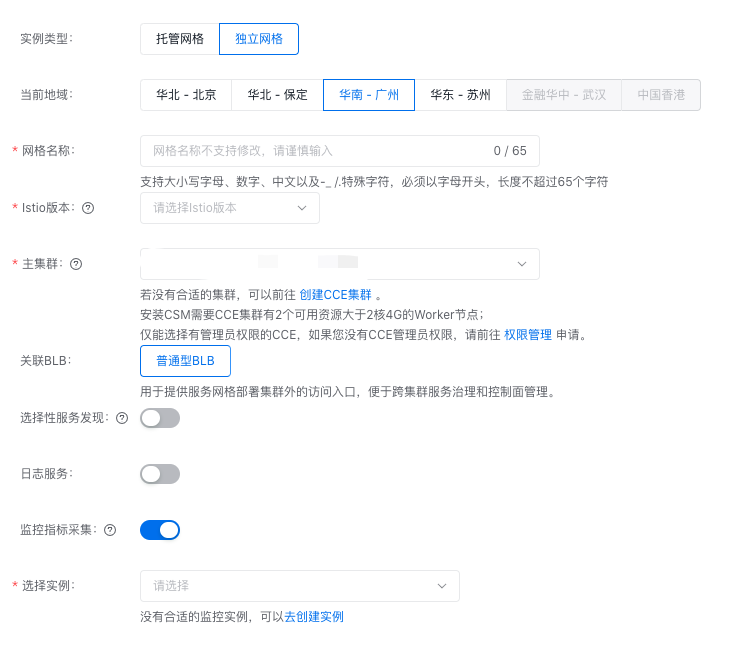 可通过以下方式开启独立网格的数据面指标监控:
配置数据面指标监控
导航路径: 产品服务->云计算->容器->服务网格 CSM->网格列表->目标独立网格实例->可观测管理->Prometheus 监控
- 在目标独立网格实例的 【Prometheus 监控】 页面,找到已绑定的 CProm 实例,单击 【Grafana 服务】 列中的服务名称,跳转到 Grafana 信息页。您可以在该页面查看 Grafana 的公网访问地址及相关访问信息,并访问 Grafana 大盘。
数据面监控指标
| 范围 | 名称 | 功能 |
|---|---|---|
| Envoy | IstioEnvoyInternalUpstreamReq503TooHigh |
503 内部上游响应的数量高于 1%,比例过高。 |
| Envoy | IstioEnvoyInternalUpstreamReq200TooLow |
200 内部上游响应的数量低于 99.9%,比例过低。 |
| Envoy | IstioEnvoyUpstreamReq503TooHigh |
Envoy 的 HTTP 503 上游响应百分比过高。 |
| Envoy | IstioEnvoyUpstreamReq200TooLow |
Envoy 的 HTTP 200 上游响应百分比过低。 |
| Envoy | IstioEnvoyClusterBindErrors |
Envoy Cluster 集群绑定错误。 |
| Envoy | IstioEnvoyClusterDstHostInvalid |
Envoy Cluster 集群目标主机无效。 |
数据面告警配置参考
YAML
1- alert: IstioEnvoyInternalUpstreamReq503TooHigh
2  annotations:
3    summary: 'Envoy Percentage of HTTP 503 internal upstream responses is too high'
4    description: "The amount of 503 internal upstream responses is higher than 1%. It is too high"
5  expr: >
6    rate(envoy_cluster_internal_upstream_rq_503[1m])/rate(envoy_cluster_internal_upstream_rq_completed[1m]) > 0.01
7
8- alert: IstioEnvoyInternalUpstreamReq200TooLow
9  annotations:
10    summary: 'Envoy Percentage of HTTP 200 internal upstream responses is too low'
11    description: "The amount of 200 internal upstream responses is lower than 99.9%. It is too low"
12  expr: >
13    rate(envoy_cluster_internal_upstream_rq_200[1m])/rate(envoy_cluster_internal_upstream_rq_completed[1m]) < 0.999
14
15- alert: IstioEnvoyUpstreamReq503TooHigh
16  annotations:
17    summary: 'Envoy Percentage of HTTP 503 upstream responses is too high'
18    description: "The amount of 503 upstream responses is higher than 1%. It is too high"
19  expr: >
20    rate(envoy_cluster_upstream_rq_503[1m])/rate(envoy_cluster_upstream_rq_completed[1m]) > 0.01
21
22- alert: IstioEnvoyUpstreamReq200TooLow
23  annotations:
24    summary: 'Envoy Percentage of HTTP 200 upstream responses is too low'
25    description: "The amount of 200 upstream responses is lower than 99.9%. It is too low"
26  expr: >
27    rate(envoy_cluster_upstream_rq_200[1m])/rate(envoy_cluster_upstream_rq_completed[1m]) < 0.999
28
29- alert: IstioEnvoyClusterBindErrors
30  annotations:
31    summary: "Envoy cluster binding errors"
32    description: "Error in binding cluster with {{ $labels.pod_name }} pod in {{ $labels.namespace }} namespace."
33  expr: >
34    envoy_cluster_bind_errors > 0
35
36- alert: IstioEnvoyClusterDstHostInvalid
37  annotations:
38    summary: "Envoy cluster destination host invalid"
39    description: "Envoy cluster destination host {{ $labels.pod_name }} in {{ $labels.namespace }} namespace invalid for 1 minutes"
40  expr: >
41    envoy_cluster_original_dst_host_invalid > 0
42  for: 1m
评价此篇文章