
常见问题
常见调试工具
- 查看控制平面debug级别的日志,编辑 deploy istiod --log_output_level=default:debug
- 更改业务 Pod 中的 istio-proxy 日志等级,查看 envoy 的日志
1# 1. 修改日志级别(包含none、error、warn、info、debug)
2istioctl -n namespace proxy-config log <pod> --level 日志级别
3
4# 2. 变更 envoy 中日志级别
5kubectl -n default exec -it  pod名称 -c istio-proxy bash
6# 变更 envoy 中的所有组件的日志级别
7curl -s -X POST 127.1:15000/logging?level=trace
8# 变更 envoy 中的 lua 日志级别
9curl -s -X POST 127.1:15000/logging?lua=debug- 查看 Envoy 的 xds 配置
1# 在 istio-proxy 容器中
2curl localhost:15000/config_dump > config_dump- 获取 istiod 控制平面中的所有的 CRD 信息
1curl -s 127.1:15014/debug/configz- 获取控制平面的内部状态和指标信息
1curl -s 127.1:15014/metrics- 获取数据平面 Envoy 收取到服务发现的实例信息及状态指标
1curl -s 127.1:15000/clusters配置完 DestinationRule 后出现503
排查:
可以查看是否由于 DestinationRule 与全局的 TLS 策略有冲突导致,此错误只有在安装期间禁用了自动双向 TLS 时才会看到。
使用注意事项:
任何时候应用 DestinationRule,都要确保 trafficPolicy TLS mode 和全局的配置一致。
控制平面出现 pilot_eds_no_instances 指标
原因:
可能是 service selector 标签没有匹配到相关联的 pod,或者 service 与之关联的 pod 没有启动。
排查:
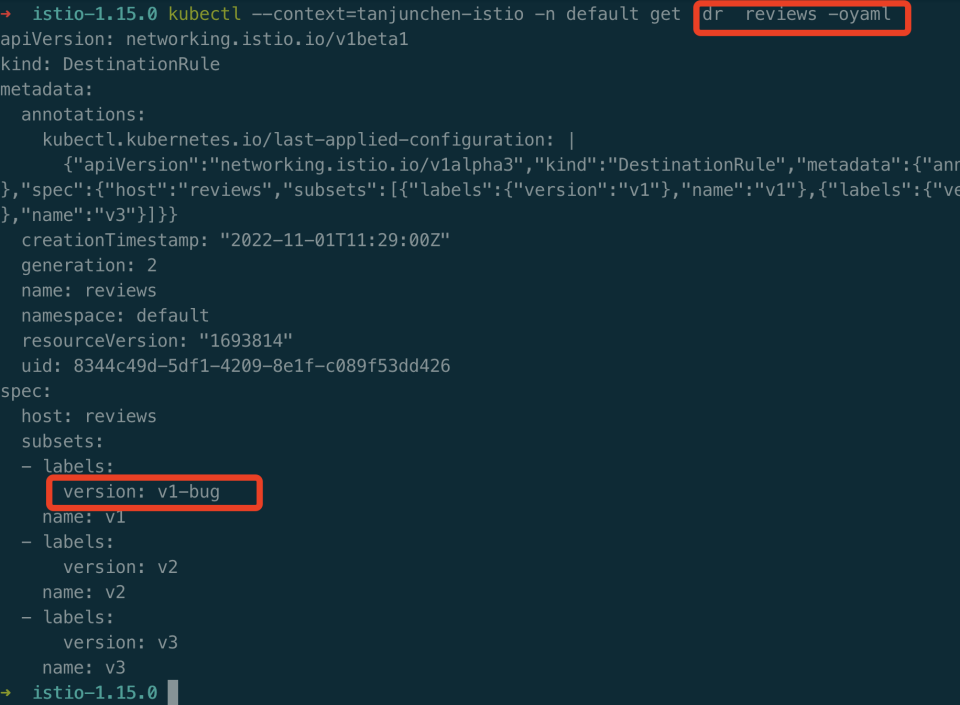
可以排查 pod 的标签与 Service selector 字段是否匹配,DestinationRule 子集标签是否配置正确,或者查看 ep 是否关联了这个 pod。
案例:
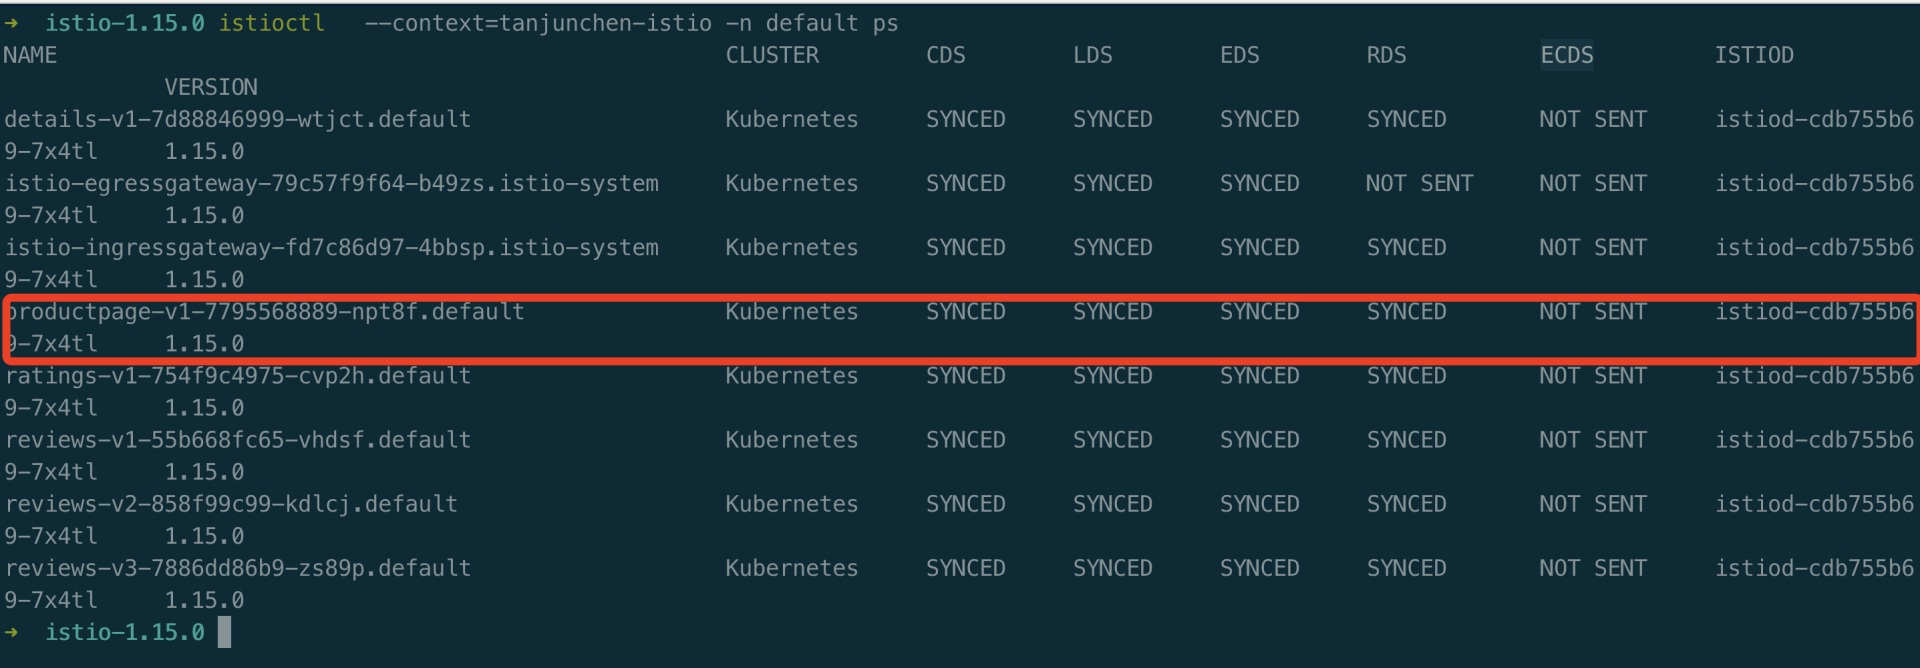
展示 istioctl ps 如下所示:
手动编辑 DestinationRule review name v1 的 version 为 v1-bug。
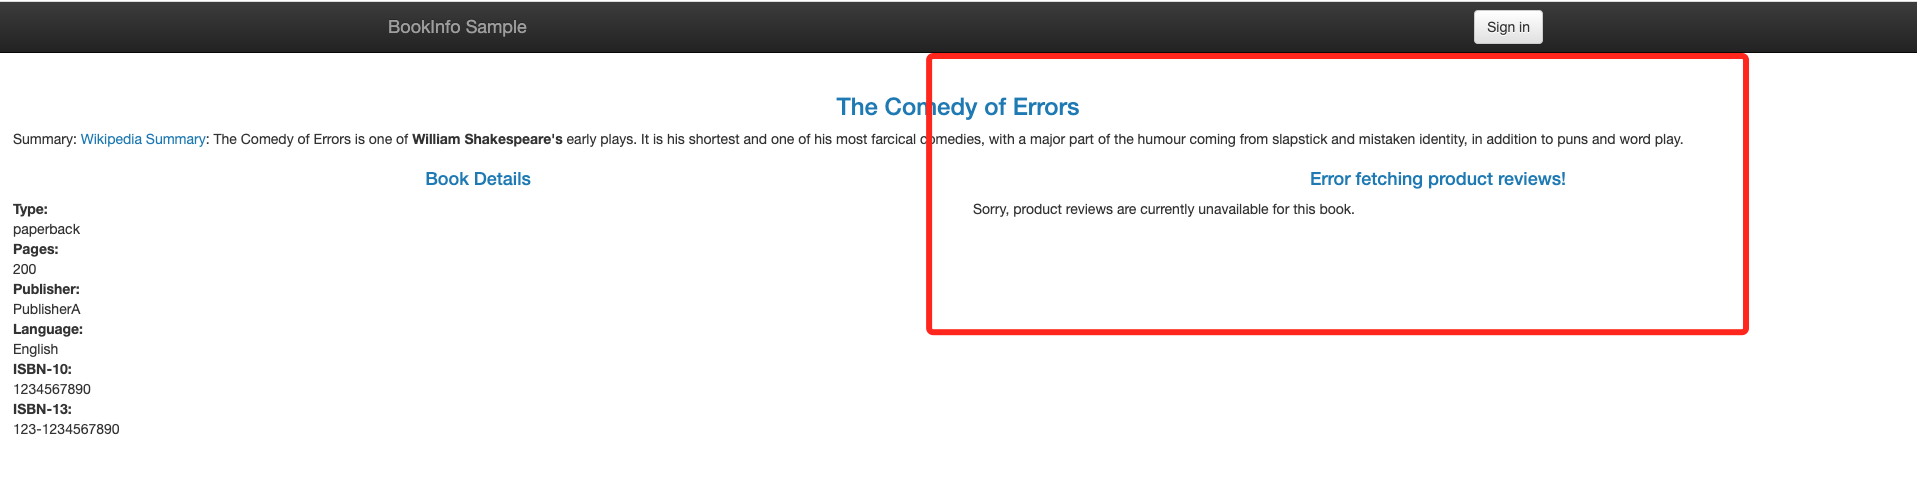
 重新从浏览器打开页面,review 页面出现报错。
快速定位:
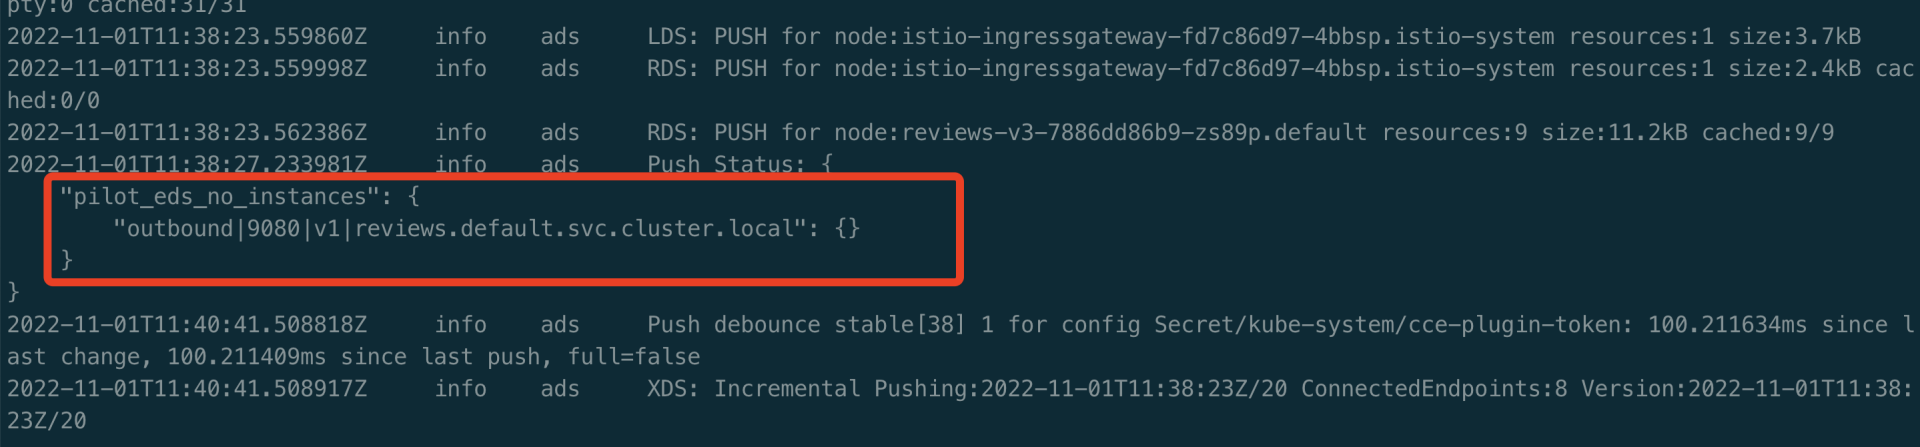
1、查看 istiod 控制平面的日志,出现 pilot_eds_no_instances 异常指标。
2、查看 productpage Pod 中的业务 istio-proxy 日志。
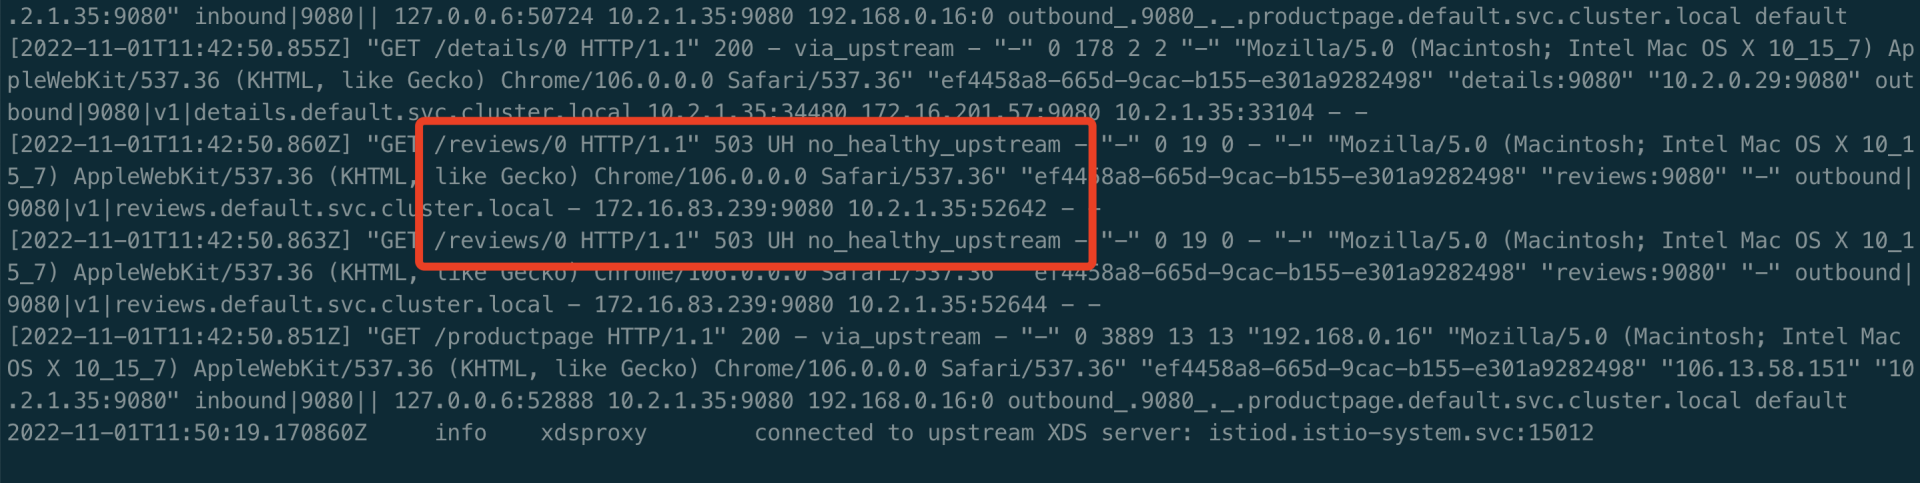
3、进入到 productpage Pod 中的 istio-proxy 中,查看 clusters。可以查看到 envoy 没有 reviews v1 相关的 cluster,v2/v3 而是有相关的 cluster。
1curl localhost:15000/clusters | grep reviews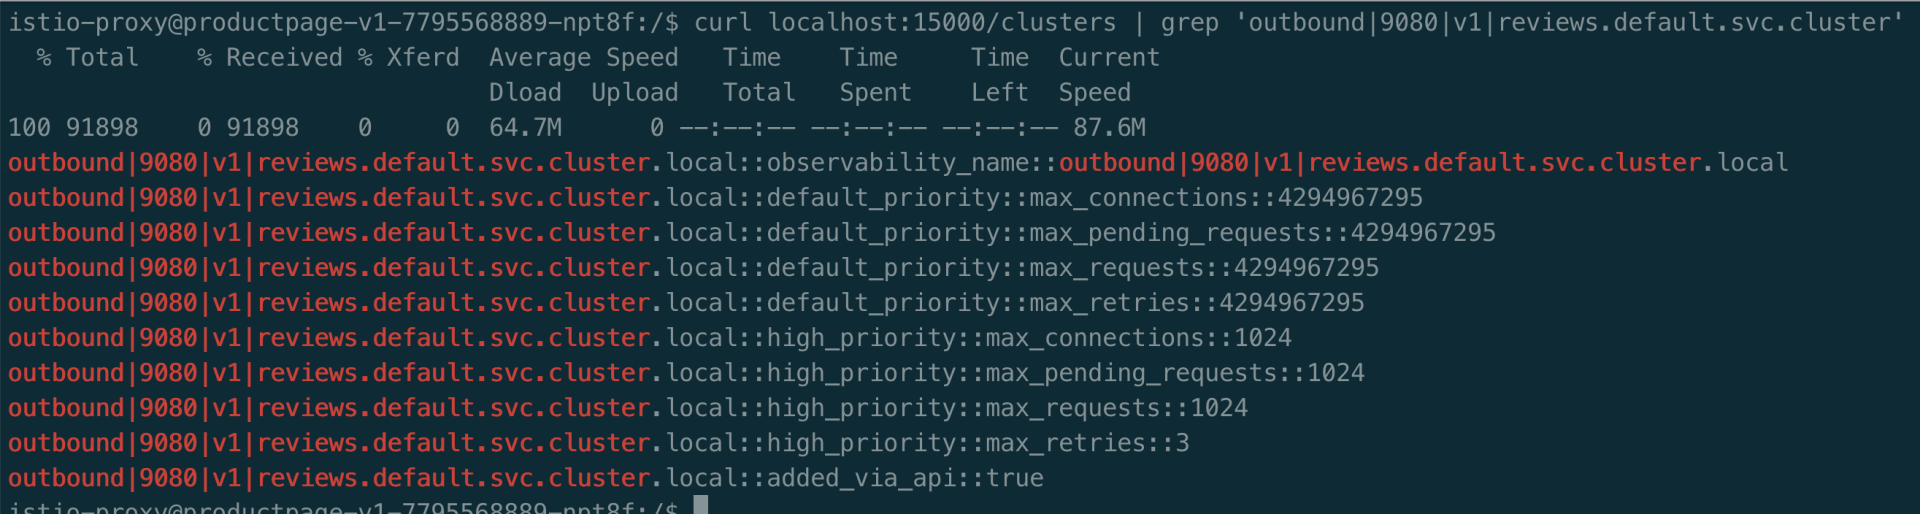
4、查看 productpage Pod 中的 istio-proxy 的 config_dump 文件。
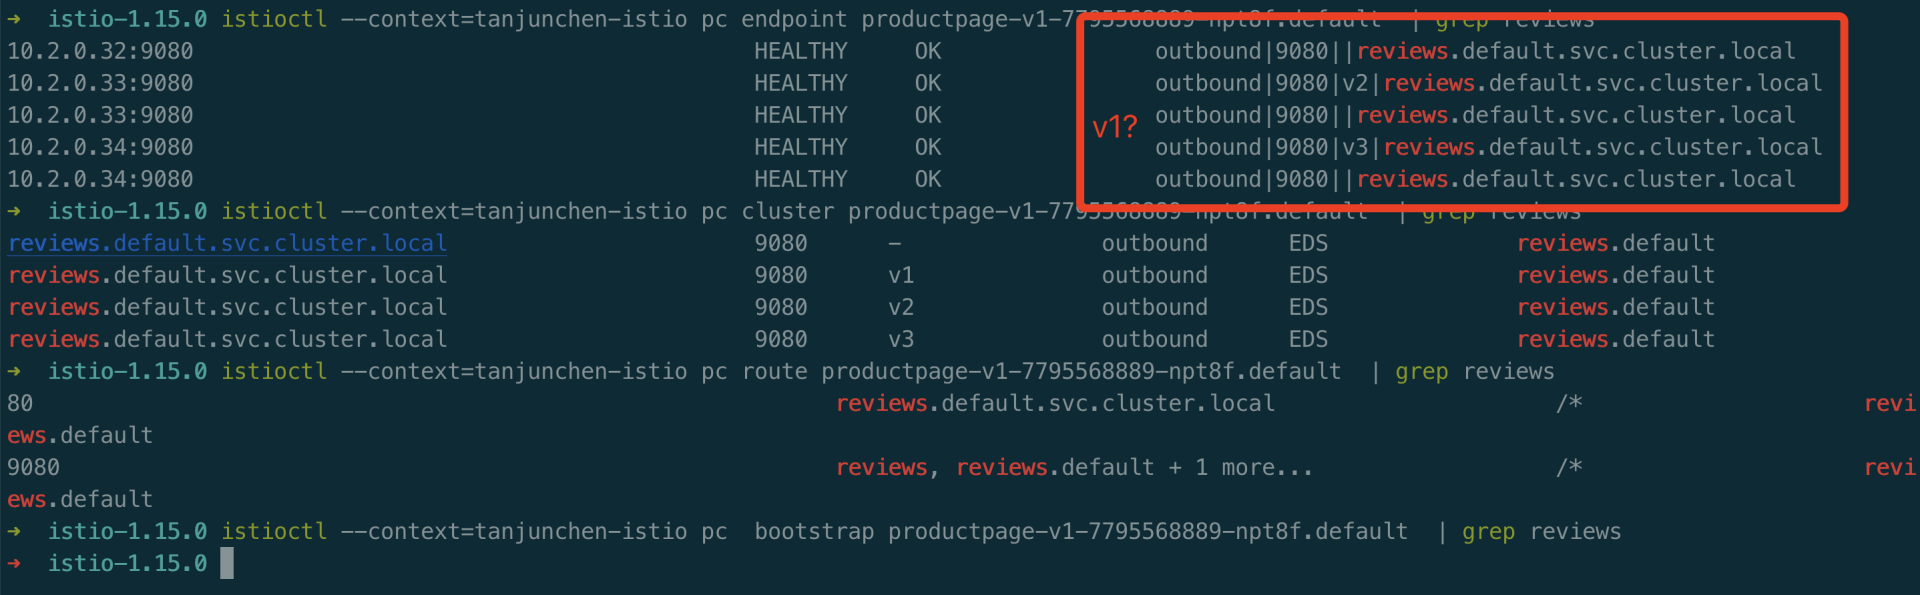
1kubectl -n default exec -it productpage-v1-7795568889-npt8f -c istio-proxy -- curl localhost:15000/config_dump > config_dump5、使用 istioctl 工具,pc、ps 查看 all、bootstrap、cluster、endpoint、listener、log、route、secret 等 envoy 运行时的参数。
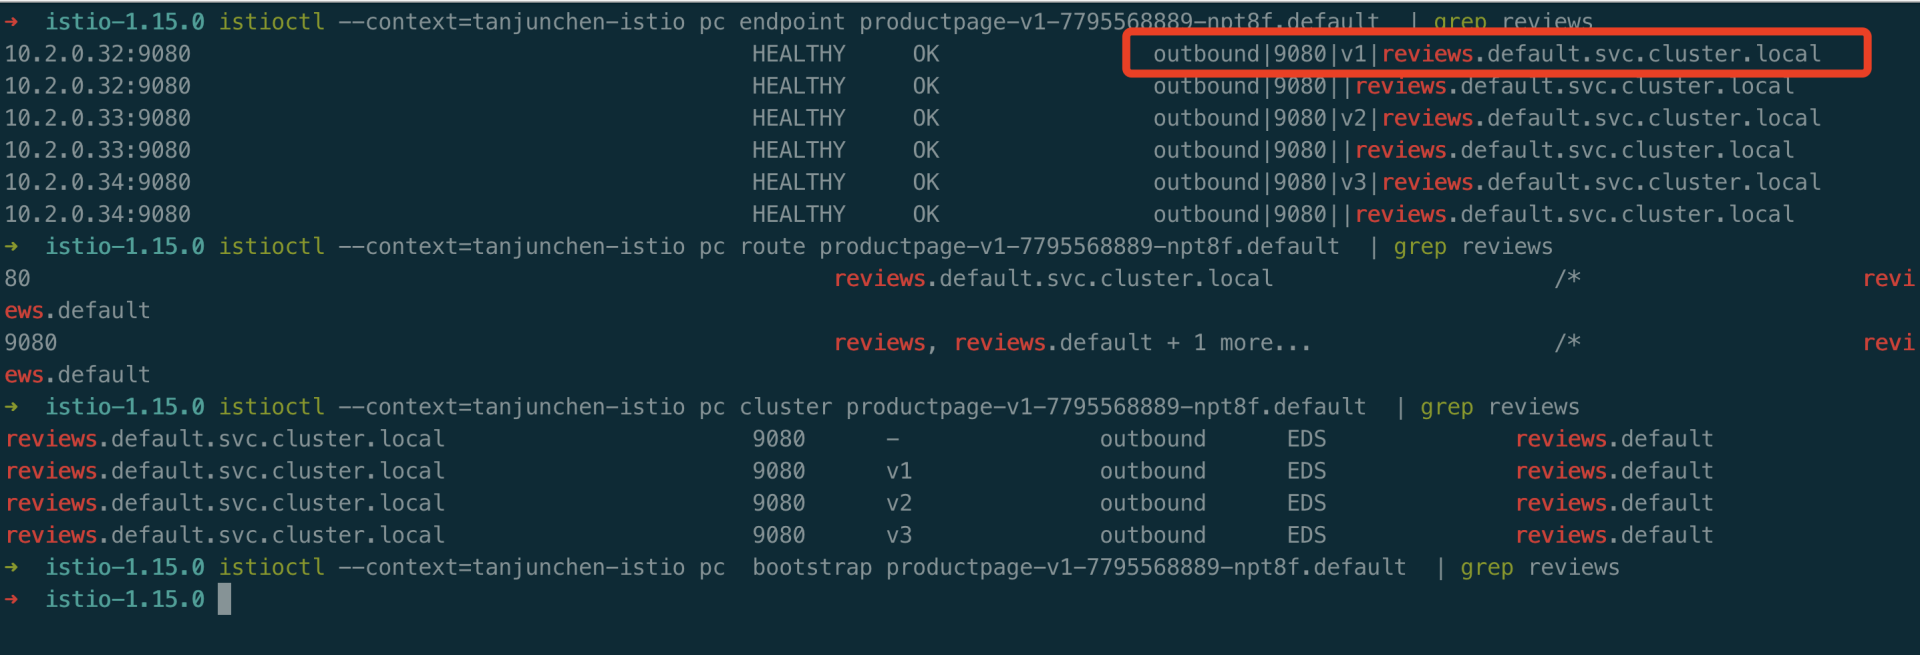
 编辑 Destinationrule reviews 恢复正常。
控制平面出现 pilot_conflict_inbound_listener 指标
原因:
该指标是由于协议冲突导致的 。
排查:
重点排查 k8s Service 资源,是否存在相同端口上配置了不同协议的情况。
灰度发布场景中,未按照预期配置进行流量治理
排查:
- 可以排查 VirtualService 的 host 字段是否配置错误,match 字段的匹配规则是否错误,和关于子集的配置是否错误,还有 DestinationRule 下标签和子集是否匹配等方面。
- 添加或删除配置时候,可能出现503错误,这是由于配置传播未到达导致。为确保不出现此情况,在添加配置时,应当先更新 DestinationRule,再更新 VirtualService 的配置对新添加的子集进行引用。当删除子集时,应当先删除 VirtualService 对任何子集的引用,再更新 DestinationRule ,删除不用的子集。
- 还可能出现配有故障注入和重试/超时策略的 VirtualService 未按预期工作。 Istio 不支持在同一个 VirtualService 上配置故障注入和重试或超时策略,如果有此需求,可以通过 EnvoyFilter 注入故障。
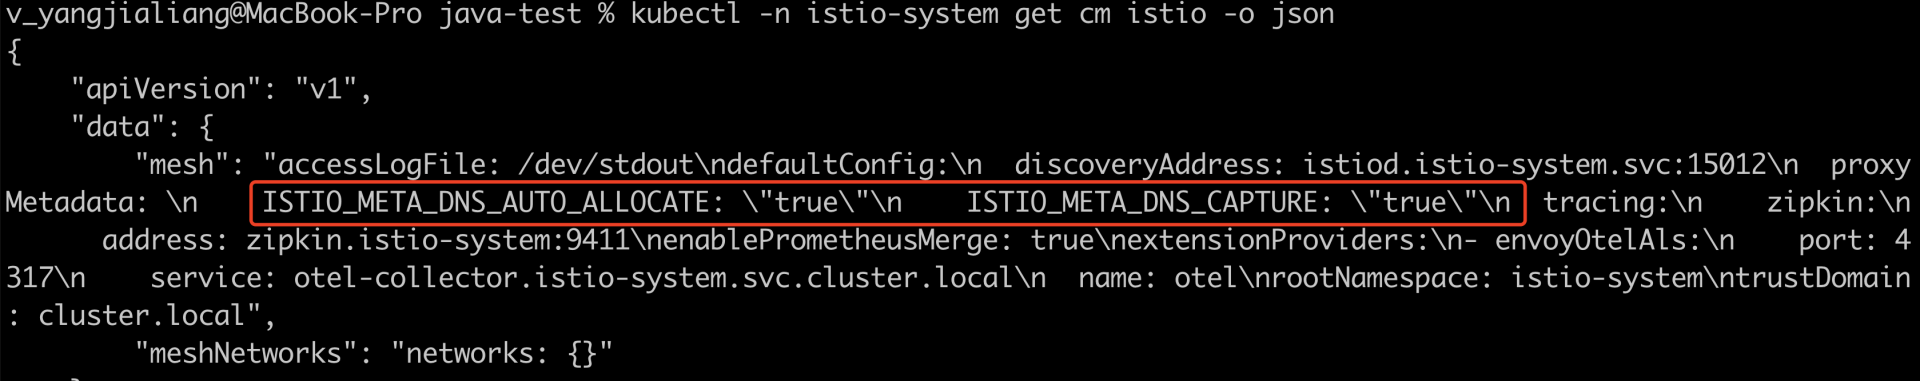
配置 ServiceEnvoy 将外部服务注册到网格内部时未生效
排查:
可能是网格内部未开启对 DNS 的相关配置,可以检查下 istio-system 命名空间下的 configmap istio proxyMetadata字段。
sidecar 自动注入失败
排查:
- 首先确保 pod 不在 kube-system 或 kube-public命名空间中。 这些命名空间中的 Pod 将忽略 Sidecar 自动注入 。
- 确保 Pod 定义中没有 hostNetwork:true。 hostNetwork:true 的 Pod 将忽略 Sidecar 自动注入。
- 检查 webhook 关于自动注入的标签是否出现问题 或者 istio-system 命名空间下的 configmap istio-sidecar-injector 的默认注入策略是否有误。
- 排查 pod 中的标签 sidecar.istio.io/inject: "true" 是否设置有误,true 为强制注入,false 则不会强制注入 sidecar。
- 在注入失败的 Pod 的 Deployment 上运行 kubectl -n namespace describe deployment name。通常能在事件中看到调用注入 webhook 失败的原因。
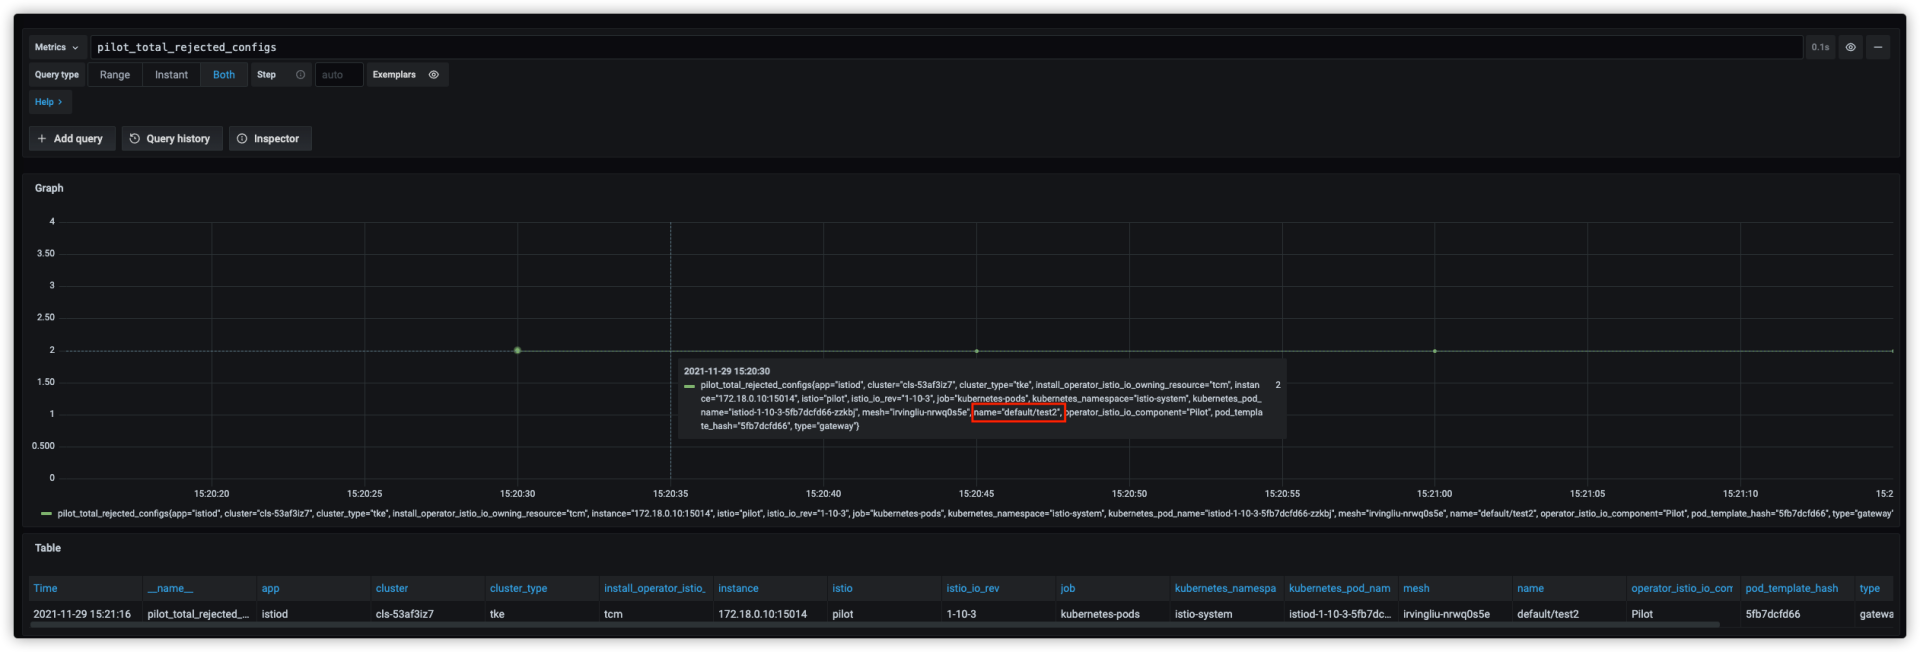
控制平面出现 pilot_total_rejected_configs 指标
现象:
网格中同时存在以下两个 Gateway
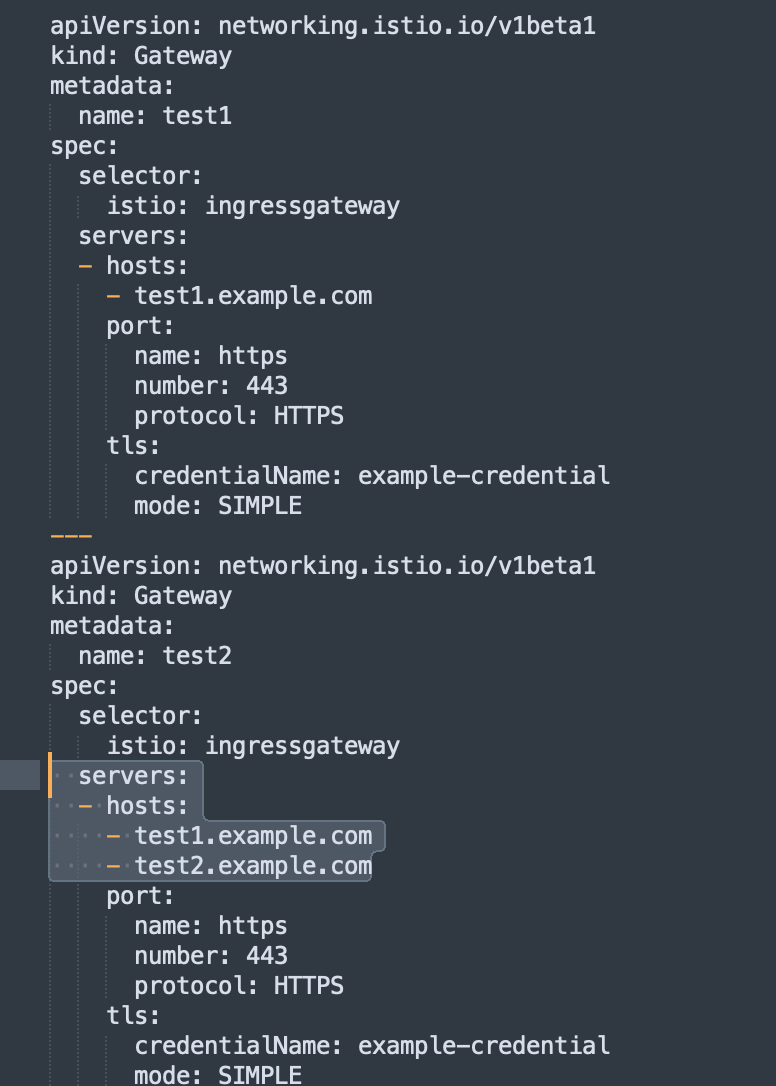
 请求 https://test1.example.com 正常返回 404,说明访问到了,请求 https://test2.example.com 出现异常。
原因:
通过 istiod 监控发现 pilot_total_rejected_configs 指标异常,显示 default/test2 配置被拒绝,导致被拒绝的原因是 每个域名在同一端口上只能配置一次 TLS,我们这里 test1.example.com 在 2 个 Gateway 的 443 端口都配置了 TLS, 导致其中一个被拒绝,通过监控确认被拒绝的是 test2,test2.example.com 和 test1.example.com 配置在 test2 的同一个 Server,Server 配置被拒绝导致请求异常,解决此问题可以把 test 1删除。删除后,请求恢复正常。
Envoy 日志中出现 headers size exceeds limit 错误
背景:
某个客户接入mesh后有个API接口调用失败,envoy 包含inbound、outbound两个方向,具体报错详情参考如下所示。
报错日志:
1日志报错 2022-12-31T14:24:27.501043Z debug envoy client [C4689] protocol error: headers size exceeds limit相关问题:
https://github.com/envoyproxy/envoy/issues/13827
解决方案:
通过 envoyfilter 调大默认限制值。
1apiVersion: networking.istio.io/v1alpha3
2kind: EnvoyFilter
3metadata:
4  name: max-header
5  namespace: istio-system
6spec:
7  configPatches:
8  - applyTo: NETWORK_FILTER
9    match:
10      context: ANY
11      listener:
12        filterChain:
13          filter:
14            name: "envoy.http_connection_manager"
15    patch:
16      operation: MERGE
17      value:
18        typed_config:
19          "@type": "type.googleapis.com/envoy.extensions.filters.network.http_connection_manager.v3.HttpConnectionManager"
20          max_request_headers_kb: 80
21          common_http_protocol_options:
22            max_headers_count: 500
23  - applyTo: CLUSTER
24    match:
25      context: ANY
26      cluster:
27        portNumber: 5000
28    patch:
29      operation: MERGE
30      value: # cluster specification
31        common_http_protocol_options:
32          max_headers_count: 500
总结:
原因1:pod 中监听的端口与程序启动监听的端口不匹配,会导致出现 503 问题
原因2:envoy 自身对于 header 数量的限制,会出现 502 协议问题。可参见:https://github.com/envoyproxy/envoy/issues/13827
排错思路积累:
503 错误可以考虑 程序监听的端口与 Pod 配置的端口不一致。
502 错误可以考虑 header 数量过大导致,通过 istio-proxy debug 日志可以观察。
参考:
- https://github.com/envoyproxy/envoy/issues/13827
- https://www.gl.sh.cn/2022/04/11/network_filter-httpconnectionmanager.html
- https://github.com/envoyproxy/envoy/issues/11774
- https://github.com/envoyproxy/envoy/pull/12216
如何给Envoy开启AccessLog访问日志
我们可以通过 Telemetry API、Mesh Config、EnvoyFilter 三种方式开启 Envoy 的 access log 日志。
Telemetry API
1cat <<EOF > ./telemtry-example.yaml
2apiVersion: telemetry.istio.io/v1alpha1
3kind: Telemetry
4metadata:
5  name: mesh-default
6spec:
7  selector:
8    matchLabels:
9      app: helloworld
10  accessLogging:
11    - providers:
12      - name: envoy
13EOF
14
15kubectl apply -f ./telemtry-example.yaml
我们查看 helloworld 中的 istio-proxy 中的日志,可以看到下发的 Telemetry 配置生效了。
1$ kubectl -n test logs helloworld-v2-7d55d87964-6tncj -c istio-proxy --tail=10
22023-04-17T09:27:13.557757Z	info	xdsproxy	connected to upstream XDS server: 192.168.0.6:15012
32023-04-17T09:57:43.387553Z	info	xdsproxy	connected to upstream XDS server: 192.168.0.6:15012
42023-04-17T10:30:52.106631Z	info	xdsproxy	connected to upstream XDS server: 192.168.0.6:15012
52023-04-17T10:59:38.532144Z	info	xdsproxy	connected to upstream XDS server: 192.168.0.6:15012
6[2023-04-17T11:02:59.500Z] "GET /hello HTTP/1.1" 200 - via_upstream - "-" 0 60 119 119 "-" "curl/7.87.0-DEV" "4d166eba-cb47-4147-a182-7a3896643d06" "helloworld:5000" "x.x.x.x:5000" inbound|5000|| x.x.x.x:37311 x.x.x.x:5000 x.x.x.x:54644 outbound_.5000_._.helloworld.test.svc.cluster.local default
7[2023-04-17T11:03:00.923Z] "GET /hello HTTP/1.1" 200 - via_upstream - "-" 0 60 123 122 "-" "curl/7.87.0-DEV" "fbd2b87a-913c-4d6f-8f8a-c625f1aaf80e" "helloworld:5000" "x.x.x.x:5000" inbound|5000|| x.x.x.x:38235 x.x.x.x:5000 x.x.x.x:54656 outbound_.5000_._.helloworld.test.svc.cluster.local default
8[2023-04-17T11:03:39.534Z] "GET /hello HTTP/1.1" 200 - via_upstream - "-" 0 60 119 119 "-" "curl/7.87.0-DEV" "bc364db9-dc03-4331-95db-ffea73fe5c0a" "helloworld:5000" "x.x.x.x:5000" inbound|5000|| x.x.x.x:52206 x.x.x.x:5000 x.x.x.x:54644 outbound_.5000_._.helloworld.test.svc.cluster.local default
9[2023-04-17T11:03:42.281Z] "GET /hello HTTP/1.1" 200 - via_upstream - "-" 0 60 116 116 "-" "curl/7.87.0-DEV" "b88fa88a-5ec1-4747-945b-8ace802db94f" "helloworld:5000" "x.x.x.x:5000" inbound|5000|| x.x.x.x:33526 x.x.x.x:5000 x.x.x.x:54644 outbound_.5000_._.helloworld.test.svc.cluster.local default
10[2023-04-17T11:03:43.371Z] "GET /hello HTTP/1.1" 200 - via_upstream - "-" 0 60 120 119 "-" "curl/7.87.0-DEV" "dd20b26a-af35-411b-a2e5-bc7f7f847c87" "helloworld:5000" "x.x.x.x:5000" inbound|5000|| x.x.x.x:55067 x.x.x.x:5000 x.x.x.x:54656 outbound_.5000_._.helloworld.test.svc.cluster.local default
11[2023-04-17T11:03:44.500Z] "GET /hello HTTP/1.1" 200 - via_upstream - "-" 0 60 116 115 "-" "curl/7.87.0-DEV" "be3a1993-0502-4f50-ad2d-c1672594962c" "helloworld:5000" "x.x.x.x:5000" inbound|5000|| x.x.x.x:34296 x.x.x.x:5000 x.x.x.x:54644 outbound_.5000_._.helloworld.test.svc.cluster.local default
使用 Mesh Config
修改 istio 配置:
1kubectl -n istio-system edit configmap istio添加以下内容:
1apiVersion: v1
2data:
3  mesh: |-
4    # 全局修改 Envoy 输出 accesslog
5    accessLogEncoding: JSON
6    accessLogFile: /dev/stdout
7    accessLogFormat: ""
8    defaultConfig:
9      holdApplicationUntilProxyStarts: true
10    rootNamespace: istio-system
11kind: ConfigMap
12metadata:
13 name: istio1accessLogEncoding: 表示 accesslog 输出格式,istio 预定义了 TEXT 和 JSON 两种日志输出格式。默认使用 TEXT,通常我们习惯改成 JSON 以提升可读性,同时也利于日志采集。
2accessLogFile: 表示 accesslog 输出到哪里,通常我们指定到 /dev/stdout (标准输出),以便使用 kubectl logs 来查看日志,同时也利于日志采集。
3accessLogFormat: 如果不想使用 istio 预定义的 accessLogEncoding,我们也可以使用这个配置来自定义日志输出格式。使用 EnvoyFilter
1cat <<EOF > ./envoyfilter-example.yaml
2apiVersion: networking.istio.io/v1alpha3
3kind: EnvoyFilter
4metadata:
5  name: enable-accesslog
6spec:
7  configPatches:
8  - applyTo: NETWORK_FILTER
9    match:
10      context: ANY
11      listener:
12        filterChain:
13          filter:
14            name: envoy.http_connection_manager
15    patch:
16      operation: MERGE
17      value:
18        typed_config:
19          "@type": "type.googleapis.com/envoy.extensions.filters.network.http_connection_manager.v3.HttpConnectionManager"
20          access_log:
21          - name: envoy.access_loggers.file
22            typed_config:
23              "@type": type.googleapis.com/envoy.extensions.access_loggers.file.v3.FileAccessLog
24              path: "/dev/stdout"
25              log_format:
26                json_format:
27                  authority: "%REQ(:AUTHORITY)%"
28                  bytes_received: "%BYTES_RECEIVED%"
29                  bytes_sent: "%BYTES_SENT%"
30                  downstream_local_address: "%DOWNSTREAM_LOCAL_ADDRESS%"
31                  downstream_remote_address: "%DOWNSTREAM_REMOTE_ADDRESS%"
32                  duration: "%DURATION%"
33                  method: "%REQ(:METHOD)%"
34                  path: "%REQ(X-ENVOY-ORIGINAL-PATH?:PATH)%"
35                  protocol: "%PROTOCOL%"
36                  request_id: "%REQ(X-REQUEST-ID)%"
37                  requested_server_name: "%REQUESTED_SERVER_NAME%"
38                  response_code: "%RESPONSE_CODE%"
39                  response_flags: "%RESPONSE_FLAGS%"
40                  route_name: "%ROUTE_NAME%"
41                  start_time: "%START_TIME%"
42                  upstream_cluster: "%UPSTREAM_CLUSTER%"
43                  upstream_host: "%UPSTREAM_HOST%"
44                  upstream_local_address: "%UPSTREAM_LOCAL_ADDRESS%"
45                  upstream_service_time: "%RESP(X-ENVOY-UPSTREAM-SERVICE-TIME)%"
46                  upstream_transport_failure_reason: "%UPSTREAM_TRANSPORT_FAILURE_REASON%"
47                  user_agent: "%REQ(USER-AGENT)%"
48                  x_forwarded_for: "%REQ(X-FORWARDED-FOR)%"
49EOF
50
51kubectl apply -f ./envoyfilter-example.yaml
部分 workload 启用 accesslog
如果想要精确到只为指定的 workload 启用 accesslog,可以在 EnvoyFilter 上加一下 workloadSelector:
1spec:
2  workloadSelector:
3    labels:
4      app: helloworld
我们查看 helloworld 中的 istio-proxy 中的日志,可以看到下发 EnvoyFilter 配置后生效了。
1{"authority":"helloworld:5000","method":"GET","user_agent":"curl/7.87.0-DEV","bytes_received":0,"route_name":"default","upstream_host":"x.x.x.x:5000","upstream_service_time":"117","request_id":"ba543d08-28a0-4dc3-a490-6547474ff858","upstream_local_address":"x.x.x.x:39069","bytes_sent":60,"duration":117,"x_forwarded_for":null,"path":"/hello","upstream_cluster":"inbound|5000||","requested_server_name":"outbound_.5000_._.helloworld.test.svc.cluster.local","upstream_transport_failure_reason":null,"downstream_remote_address":"x.x.x.x:46866","downstream_local_address":"x.x.x.x:5000","start_time":"2023-04-17T11:22:56.569Z","response_flags":"-","protocol":"HTTP/1.1","response_code":200}使用SidecarCRD降低数据平面Envoy资源消耗
目的
给 istio 增加 Sidecar 配置,降低数据平面 Envoy 的资源消耗。
单namespace示例
单namespace集群的sidecar配置如下:
1apiVersion: networking.istio.io/v1beta1
2kind: Sidecar
3metadata:
4  name: test-sidecar
5  namespace: test
6spec:
7  egress:
8  - hosts:
9    - test/*  # 业务所在的命名空间
10    - istio-system-csm-testtest/*   # istiod 所在的命名空间,csm 实例
多namespace示例
- 涉及的namespace:test、test-1
sidecar配置如下:
1# ns为test的sidecar示例
2apiVersion: networking.istio.io/v1beta1
3kind: Sidecar
4metadata:
5  name: test-sidecar
6  namespace: test
7spec:
8  egress:
9  - hosts:
10    - test/*  # 业务所在的命名空间
11    - test-1/*  # 业务所在的命名空间
12    - istio-system-csm-testtest/*   # istiod 所在的命名空间,csm 实例
13
14# ns为test-1的sidecar
15apiVersion: networking.istio.io/v1beta1
16kind: Sidecar
17metadata:
18  name: test-sidecar
19  namespace: test-1
20spec:
21  egress:
22  - hosts:
23    - test/*  # 业务所在的命名空间
24    - test-1/*  # 业务所在的命名空间
25    - istio-system-csm-testtest/*   # istiod 所在的命名空间,csm 实例
Envoy删除部分Header
现象
业务注入的 Envoy 后,返回的 Header 中会有 x-envoy 信息,业务需要删除 x-envoy-decorator-operation header。
原因
envoy 默认会生成这些特定的 header。
解决方案
使用 envoyfilter 删除这些 header。参考的 header 如下所示:
1apiVersion: networking.istio.io/v1alpha3
2kind: EnvoyFilter
3metadata:
4  name: response-headers-filter
5spec:
6  configPatches:
7  - applyTo: NETWORK_FILTER
8    match:
9      context: ANY
10      listener:
11        filterChain:
12          filter:
13            name: "envoy.filters.network.http_connection_manager"
14    patch:
15      operation: MERGE
16      value:
17        typed_config:
18          "@type": "type.googleapis.com/envoy.extensions.filters.network.http_connection_manager.v3.HttpConnectionManager"
19          server_header_transformation: PASS_THROUGH
20  - applyTo: HTTP_ROUTE
21    match:
22      context: SIDECAR_INBOUND
23    patch:
24      operation: MERGE
25      value:
26        decorator:
27          propagate: false # removes the decorator header
28        response_headers_to_remove:
29        - x-envoy-upstream-service-time
30        - x-powered-by
31        - server
参考
https://janine.pcfe.net/posts/2022-10-10-istio-envoyfilter-strip-headers/
主集群primary Istiod 总是重启
现象
主集群 Istiod 总是发生 OOM 导致 Istiod Pod 重启,进而数据平面不能正常连接到 istiod 控制平面。
1Exec lifecycle hook ([pilot-agent wait]) for Container "istio-proxy" in Pod "podName" failed - error: command 'pilot-agent wait' exited with 255: Error: timeout waiting for Envoy proxy to become ready. Last error: HTTP status code 503 , message: "2023-03-31T01:30:00.231989Z\tinfo\tWaiting for Envoy proxy to be ready (timeout: 60 seconds)...\n2023-03-31T01:31:00.457233Z\terror\ttimeout waiting for Envoy proxy to become ready. Last error: HTTP status code 503\nError: timeout waiting for Envoy proxy to become ready. Last error: HTTP status code 503\n"原因
istiod 所在的 k8s 集群 node、pod 等 Endpoint 元数据太多,导致 xds 推送频繁,耗费较多的资源,进而 istiod 容易 OOM。
解决方案
方案一:主集群 primary 添加 node 节点,保证 istiod 能够正常调度。
方案二:使用 sidecar 限制 istiod 计算范围。案例如下所示:
1apiVersion: networking.istio.io/v1beta1
2kind: Sidecar
3metadata:
4  name: healthsvc-sidecar
5  namespace: healthsvc-xxx
6spec:
7  egress:
8  - hosts:
9    - healthsvc-xxx/*  # 业务所在的命名空间
10    - istio-system-xxx/*   # istiod 所在的命名空间
参考
- https://istio.io/latest/docs/tasks/observability/distributed-tracing/jaeger/
- https://istio.io/latest/docs/tasks/observability/metrics/customize-metrics/
- https://github.com/istio/istio/issues/44266
某业务线上接口接入Mesh后不通
现象
某个业务线上服务接入 Mesh 后,某个接口出现 502。
1正常:curl -I 'http://x.x.x.x:8080/test/hospitalImjjh/card3/s?word=西安冠心病' -H 'host: xxxx.baidu.com'
2
3异常:curl -I 'http://x.x.x.x:8080/test/hospitalImjjh/card3/s?word=%E8%A5%BF%E5%AE%89%E5%86%A0%E5%BF%83%E7%97%85' -H 'host: xxxx.baidu.com'
Envoy 的报错日志如下所示:
12023-03-31T02:56:51.929765Z     trace   envoy filter    [C5806] upstream connection received 14240 bytes, end_stream=false
22023-03-31T02:56:51.929785Z     trace   envoy connection        [C5806] writing 14240 bytes, end_stream false
32023-03-31T02:56:51.929795Z     trace   envoy connection        [C5807] socket event: 2
42023-03-31T02:56:51.929798Z     trace   envoy connection        [C5807] write ready
52023-03-31T02:56:51.929801Z     trace   envoy connection        [C5806] socket event: 2
62023-03-31T02:56:51.929802Z     trace   envoy connection        [C5806] write ready
72023-03-31T02:56:51.929844Z     trace   envoy connection        [C5806] write returns: 14240
82023-03-31T02:56:51.930000Z     trace   envoy connection        [C5805] socket event: 3
92023-03-31T02:56:51.930015Z     trace   envoy connection        [C5805] write ready
102023-03-31T02:56:51.930020Z     trace   envoy connection        [C5805] read ready. dispatch_buffered_data=false
112023-03-31T02:56:51.930039Z     trace   envoy connection        [C5805] read returns: 14333
122023-03-31T02:56:51.930049Z     trace   envoy connection        [C5805] read error: Resource temporarily unavailable
132023-03-31T02:56:51.930055Z     trace   envoy http      [C5805] parsing 14333 bytes
142023-03-31T02:56:51.930063Z     trace   envoy http      [C5805] message begin
152023-03-31T02:56:51.930076Z     trace   envoy http      [C5805] completed header: key=Content-Type value=text/html;charset=utf-8
162023-03-31T02:56:51.930089Z     trace   envoy http      [C5805] completed header: key=Transfer-Encoding value=chunked
172023-03-31T02:56:51.930107Z     trace   envoy http      [C5805] completed header: key=Connection value=close
182023-03-31T02:56:51.930118Z     trace   envoy http      [C5805] completed header: key=Vary value=Accept-Encoding
192023-03-31T02:56:51.930129Z     trace   envoy http      [C5805] completed header: key=Server value=nginx/1.8.0
202023-03-31T02:56:51.930139Z     trace   envoy http      [C5805] completed header: key=Date value=Fri, 31 Mar 2023 02:56:51 GMT
212023-03-31T02:56:51.930143Z     trace   envoy http      [C5805] completed header: key=Vary value=Accept-Encoding
222023-03-31T02:56:51.930146Z     trace   envoy http      [C5805] completed header: key=Set-Cookie value=58D4878A25DC3F9C0E2FB62870D096D3:FG=1; max-age=31536000; expires=Sat, 30-Mar-24 02:56:50 GMT; path=/; version=1; comment=bd
232023-03-31T02:56:51.930156Z     debug   envoy client    [C5805] Error dispatching received data: http/1.1 protocol error: HPE_INVALID_HEADER_TOKEN
242023-03-31T02:56:51.930160Z     debug   envoy connection        [C5805] closing data_to_write=0 type=1
252023-03-31T02:56:51.930162Z     debug   envoy connection        [C5805] closing socket: 1
262023-03-31T02:56:51.930199Z     trace   envoy connection        [C5805] raising connection event 1
272023-03-31T02:56:51.930206Z     debug   envoy client    [C5805] disconnect. resetting 1 pending requests
282023-03-31T02:56:51.930210Z     debug   envoy client    [C5805] request reset
292023-03-31T02:56:51.930213Z     trace   envoy main      item added to deferred deletion list (size=1)
302023-03-31T02:56:51.930222Z     debug   envoy router    [C5804][S6039679106682162641] upstream reset: reset reason: protocol error, transport failure reason:
312023-03-31T02:56:51.930231Z     trace   envoy connection        [C5806] socket event: 3
322023-03-31T02:56:51.930244Z     trace   envoy connection        [C5806] write ready
332023-03-31T02:56:51.930247Z     trace   envoy connection        [C5806] read ready. dispatch_buffered_data=false
原因
- 为什么两个请求,第一个请求正常 第二个会报错?
第一个能够通信的原因是:流量当成 TCP 处理。
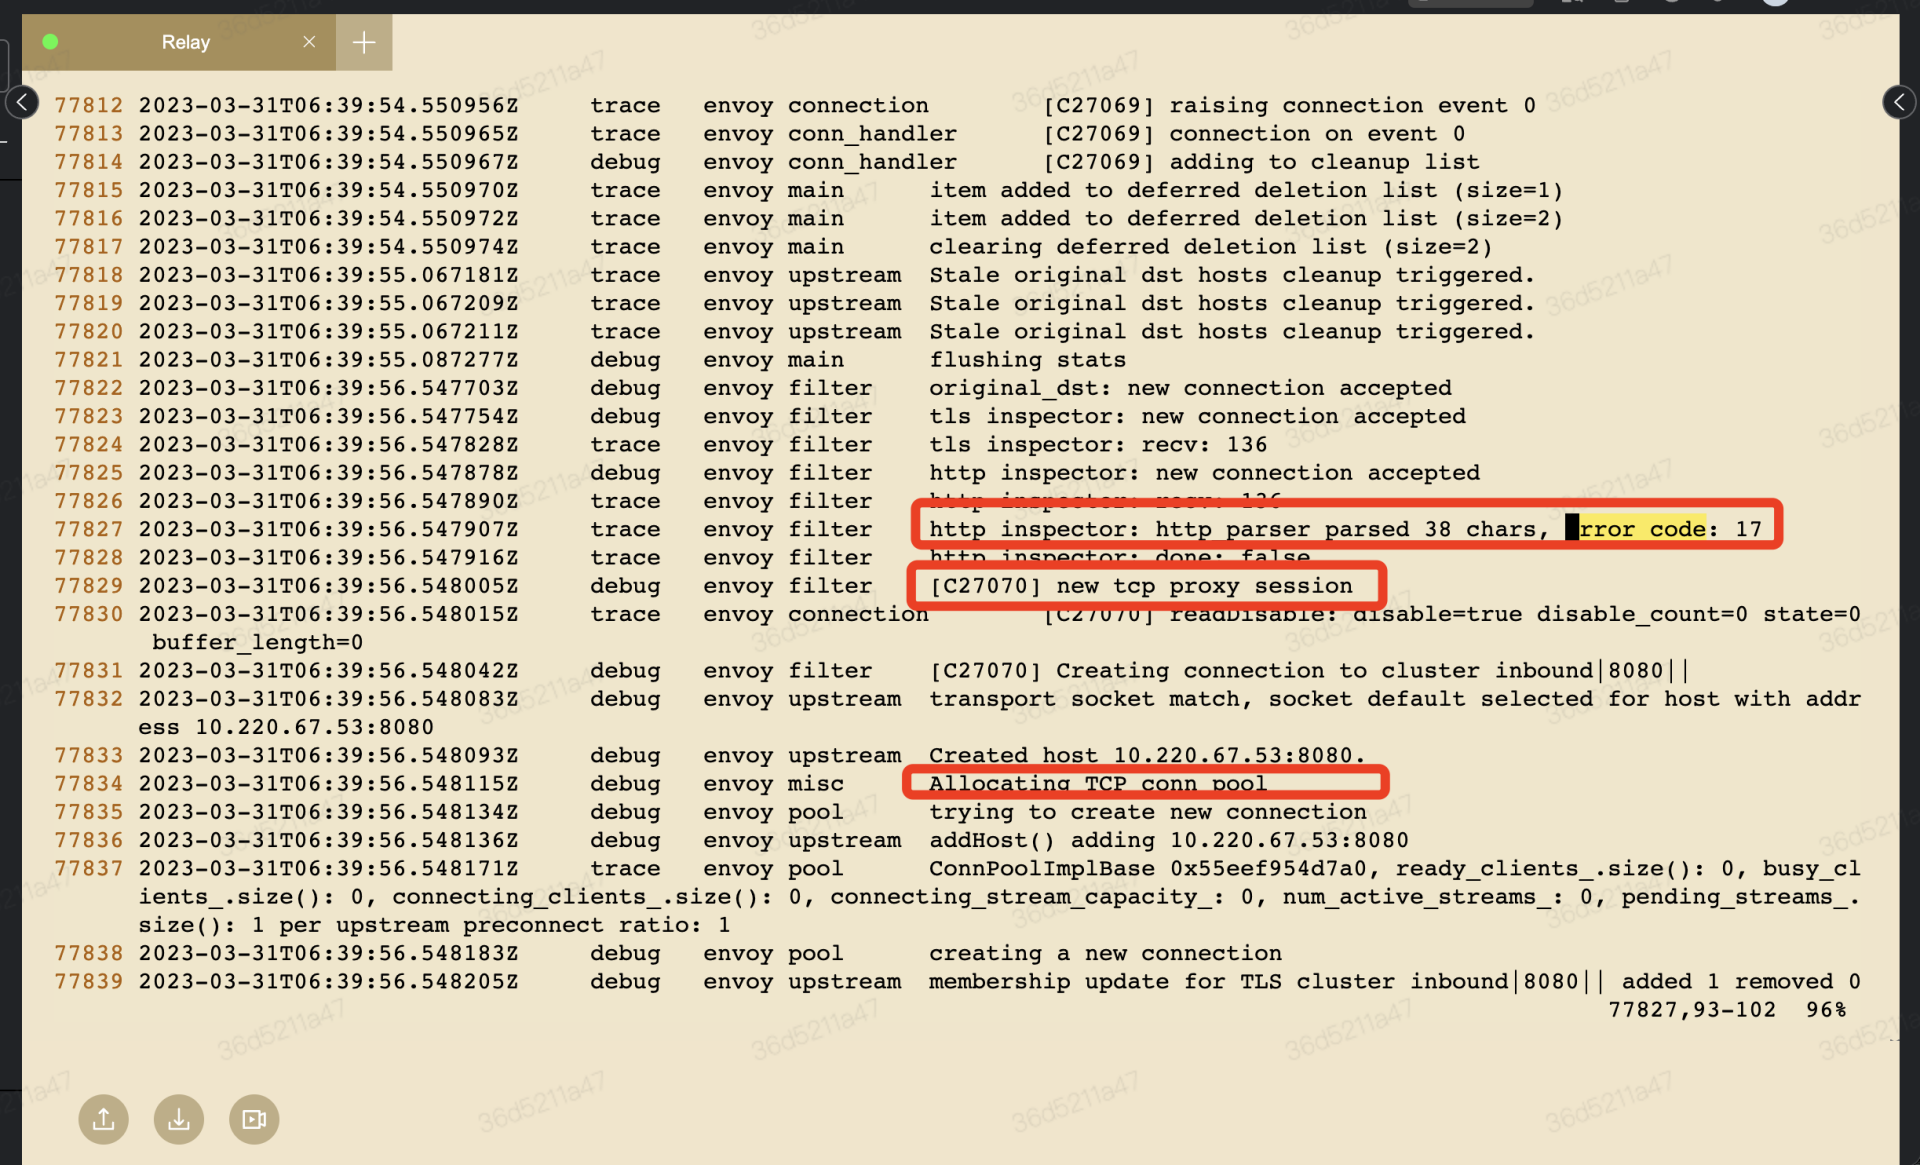
- 导致第二个请求报错的原因是:
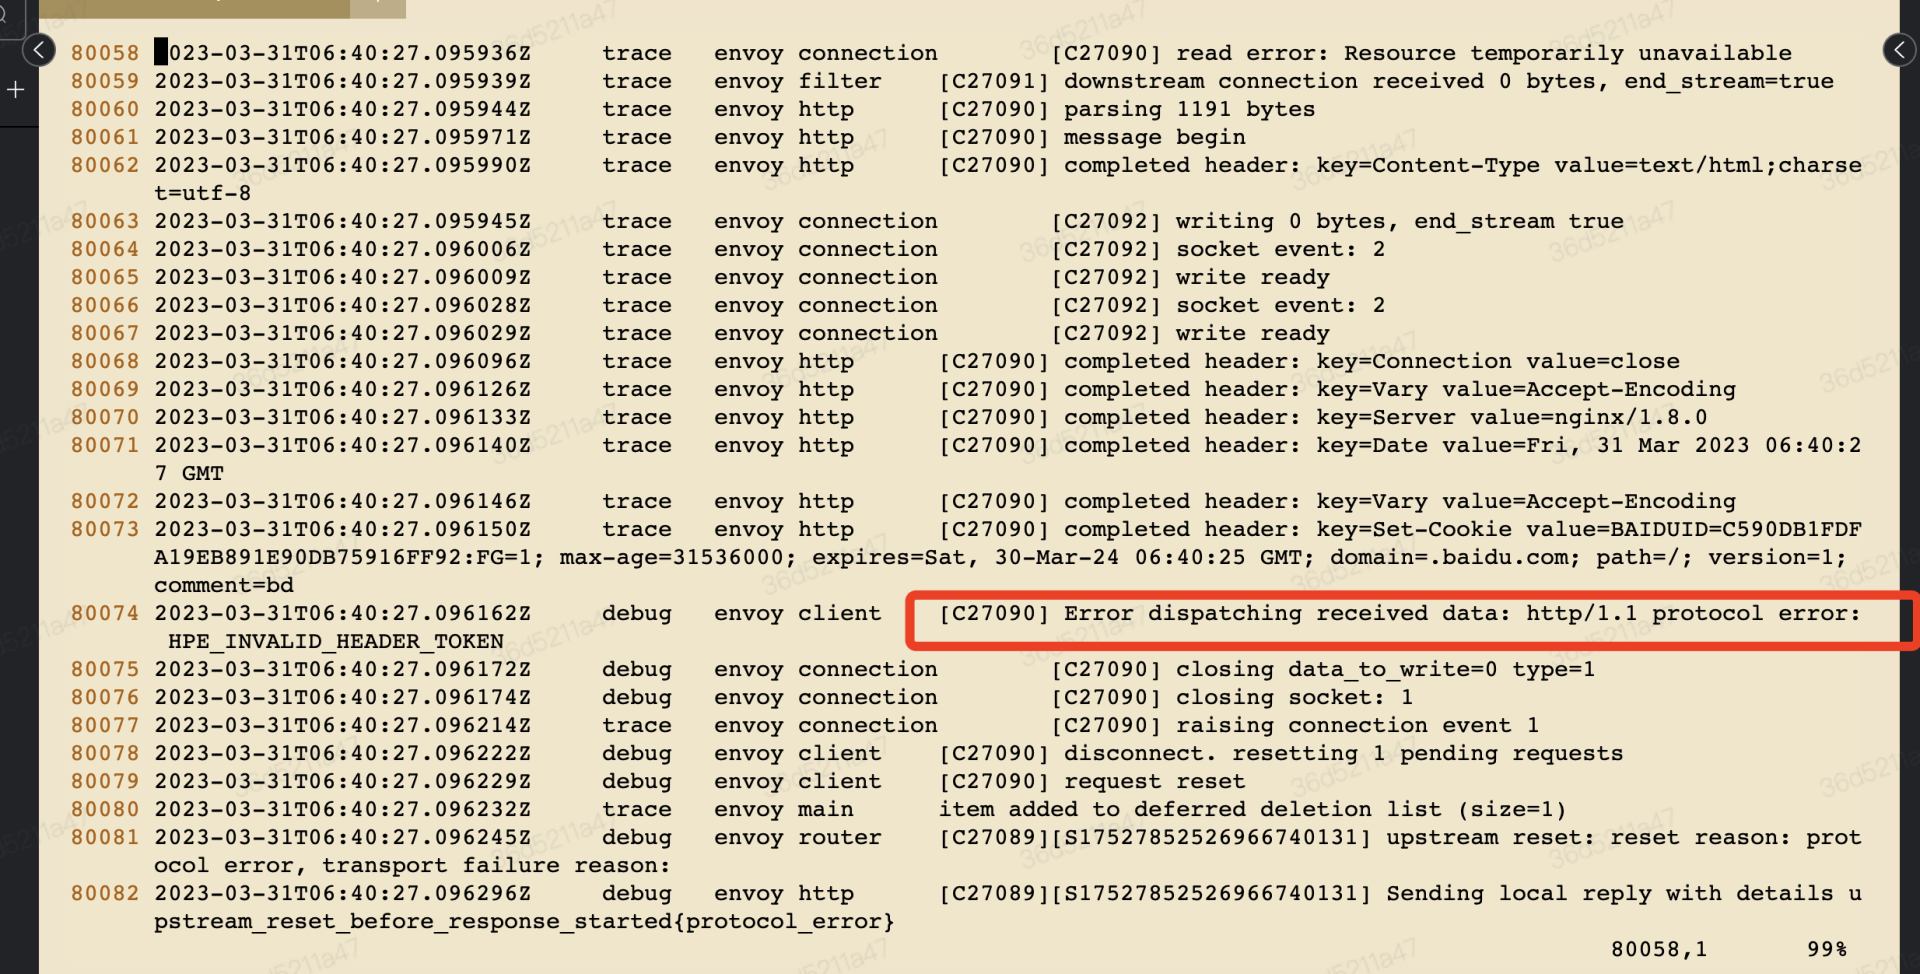
180058 2023-03-31T06:40:27.095936Z     trace   envoy connection        [C27090] read error: Resource temporarily unavailable
280059 2023-03-31T06:40:27.095939Z     trace   envoy filter    [C27091] downstream connection received 0 bytes, end_stream=true
380060 2023-03-31T06:40:27.095944Z     trace   envoy http      [C27090] parsing 1191 bytes
480061 2023-03-31T06:40:27.095971Z     trace   envoy http      [C27090] message begin
580062 2023-03-31T06:40:27.095990Z     trace   envoy http      [C27090] completed header: key=Content-Type value=text/html;charse      t=utf-8
680063 2023-03-31T06:40:27.095945Z     trace   envoy connection        [C27092] writing 0 bytes, end_stream true
780064 2023-03-31T06:40:27.096006Z     trace   envoy connection        [C27092] socket event: 2
880065 2023-03-31T06:40:27.096009Z     trace   envoy connection        [C27092] write ready
980066 2023-03-31T06:40:27.096028Z     trace   envoy connection        [C27092] socket event: 2
1080067 2023-03-31T06:40:27.096029Z     trace   envoy connection        [C27092] write ready
1180068 2023-03-31T06:40:27.096096Z     trace   envoy http      [C27090] completed header: key=Connection value=close
1280069 2023-03-31T06:40:27.096126Z     trace   envoy http      [C27090] completed header: key=Vary value=Accept-Encoding
1380070 2023-03-31T06:40:27.096133Z     trace   envoy http      [C27090] completed header: key=Server value=nginx/1.8.0
1480071 2023-03-31T06:40:27.096140Z     trace   envoy http      [C27090] completed header: key=Date value=Fri, 31 Mar 2023 06:40:2      7 GMT
1580072 2023-03-31T06:40:27.096146Z     trace   envoy http      [C27090] completed header: key=Vary value=Accept-Encoding
1680073 2023-03-31T06:40:27.096150Z     trace   envoy http      [C27090] completed header: key=Set-Cookie value=C590DB1FDF      A19EB891E90DB75916FF92:FG=1; max-age=31536000; expires=Sat, 30-Mar-24 06:40:25 GMT; path=/; version=1;       comment=bd
1780074 2023-03-31T06:40:27.096162Z     debug   envoy client    [C27090] Error dispatching received data: http/1.1 protocol error:       HPE_INVALID_HEADER_TOKEN
1880075 2023-03-31T06:40:27.096172Z     debug   envoy connection        [C27090] closing data_to_write=0 type=1
1980076 2023-03-31T06:40:27.096174Z     debug   envoy connection        [C27090] closing socket: 1
2080077 2023-03-31T06:40:27.096214Z     trace   envoy connection        [C27090] raising connection event 1
2180078 2023-03-31T06:40:27.096222Z     debug   envoy client    [C27090] disconnect. resetting 1 pending requests
2280079 2023-03-31T06:40:27.096229Z     debug   envoy client    [C27090] request reset
2380080 2023-03-31T06:40:27.096232Z     trace   envoy main      item added to deferred deletion list (size=1)
2480081 2023-03-31T06:40:27.096245Z     debug   envoy router    [C27089][S17527852526966740131] upstream reset: reset reason: prot      ocol error, transport failure reason:
2580082 2023-03-31T06:40:27.096296Z     debug   envoy http      [C27089][S17527852526966740131] Sending local reply with details u      pstream_reset_before_response_started{protocol_error}
业务流量抓包
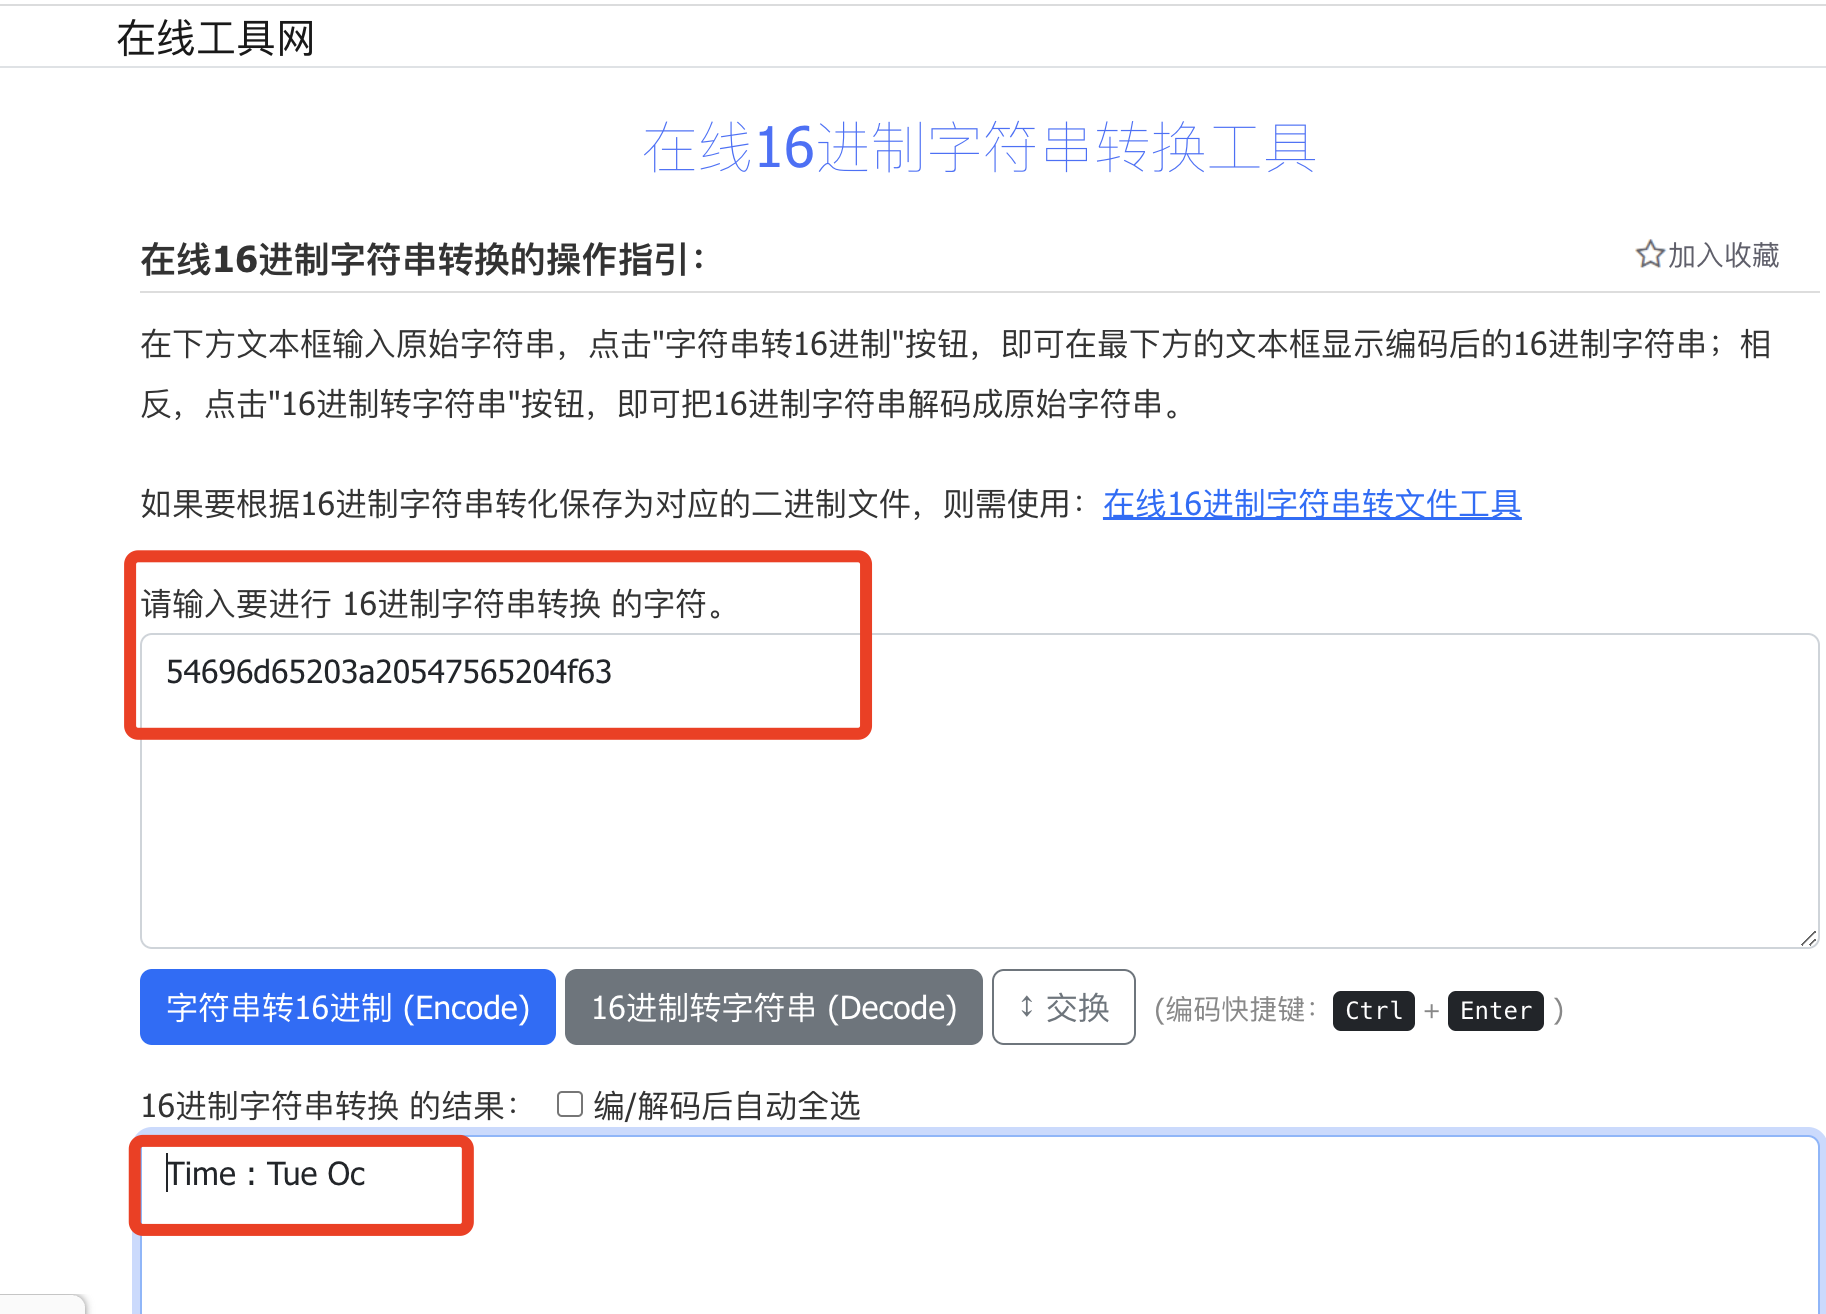
1        0x03d0:  7061 7468 3d2f 0d0a 5374 7269 6374 2d54  path=/..Strict-T
2        0x03e0:  7261 6e73 706f 7274 2d53 6563 7572 6974  ransport-Securit
3        0x03f0:  793a 206d 6178 2d61 6765 3d31 3732 3830  y:.max-age=17280
4        0x0400:  300d 0a54 696d 6520 3a20 5475 6520 4f63  0..Time.:.Tue.Oc
5        0x0410:  7420 3138 2031 313a 3234 3a35 3020 4353  t.18.11:24:50.CS
6        0x0420:  5420 3230 3232 0d0a 5472 6163 6569 643a  T.2022..Traceid:
7        0x0430:  2031 3638 3033 3535 3131 3530 3537 3335  .168035511505735
8        0x0440:  3937 3435 3038 3739 3139 3332 3734 3131  9745087919327411
9        0x0450:  3330 3639 3832 3438 0d0a 5661 7279 3a20  30698248..Vary:.
10        0x0460:  4163 6365 7074 2d45 6e63 6f64 696e 670d  Accept-Encoding.
11        0x0470:  0a58 2d47 732d 466c 6167 3a20 3078 300d  .X-Gs-Flag:.0x0.
 有问题的 header key
10x0400: 300d 0a54 696d 6520 3a20 5475 6520 4f63 0..Time.:.Tue.Oc"Time :" 这里有个空格,不符合 header 规范,触发envoy检测header报错。
Error dispatching received data: http/1.1 protocol error: HPE_INVALID_HEADER_TOKEN
线下环境复现和调试
下载envoy (使用1.18.3版本),使用如下最简配置文件启动envoy,转发流量到业务服务。
1admin:
2  address:
3    socket_address: { address: 127.0.0.1, port_value: 9901 }
4
5static_resources:
6  listeners:
7  - name: listener_0
8    address:
9      socket_address: { address: 127.0.0.1, port_value: 10000 }
10    filter_chains:
11    - filters:
12      - name: envoy.filters.network.http_connection_manager
13        typed_config:
14          "@type": type.googleapis.com/envoy.extensions.filters.network.http_connection_manager.v3.HttpConnectionManager
15          stat_prefix: ingress_http
16          codec_type: AUTO
17          route_config:
18            name: local_route
19            virtual_hosts:
20            - name: local_service
21              domains: ["*"]
22              routes:
23              - match: { prefix: "/" }
24                route: { cluster: some_service }
25          http_filters:
26          - name: envoy.filters.http.router
27            typed_config:
28              "@type": type.googleapis.com/envoy.extensions.filters.http.router.v3.Router
29  clusters:
30  - name: some_service
31    connect_timeout: 0.25s
32    type: STATIC
33    lb_policy: ROUND_ROBIN
34    load_assignment:
35      cluster_name: some_service
36      endpoints:
37      - lb_endpoints:
38        - endpoint:
39            address:
40              socket_address:
41                address: 业务IP
42                port_value: 业务端口
请求envoy 发送业务请求,即可看到如下报错(开启envoy日志等级为debug)。
1[2023-04-01 18:14:44.358][1535551][trace][connection] [source/common/network/raw_buffer_socket.cc:38] [C17] read error: Resource temporarily unavailable
2[2023-04-01 18:14:44.358][1535551][trace][http] [source/common/http/http1/codec_impl.cc:555] [C17] parsing 1079 bytes
3[2023-04-01 18:14:44.358][1535551][trace][http] [source/common/http/http1/codec_impl.cc:834] [C17] message begin
4[2023-04-01 18:14:44.358][1535551][trace][http] [source/common/http/http1/codec_impl.cc:475] [C17] completed header: key=idcinfo value=hba
5[2023-04-01 18:14:44.358][1535551][trace][http] [source/common/http/http1/codec_impl.cc:475] [C17] completed header: key=Bdqid value=43e2823cd8d4f5df
6[2023-04-01 18:14:44.358][1535551][trace][http] [source/common/http/http1/codec_impl.cc:475] [C17] completed header: key=Bdqid value=43e2823cd8d4f5df
7[2023-04-01 18:14:44.358][1535551][trace][http] [source/common/http/http1/codec_impl.cc:475] [C17] completed header: key=Bdsvrtm value=2374
8[2023-04-01 18:14:44.358][1535551][trace][http] [source/common/http/http1/codec_impl.cc:475] [C17] completed header: key=Cache-Control value=no-cache
9[2023-04-01 18:14:44.358][1535551][trace][http] [source/common/http/http1/codec_impl.cc:475] [C17] completed header: key=Content-Type value=text/html;charset=utf-8
10[2023-04-01 18:14:44.358][1535551][trace][http] [source/common/http/http1/codec_impl.cc:475] [C17] completed header: key=Date value=Sat, 01 Apr 2023 10:14:44 GMT
11[2023-04-01 18:14:44.358][1535551][trace][http] [source/common/http/http1/codec_impl.cc:475] [C17] completed header: key=P3p value=CP=" OTI DSP COR IVA OUR IND COM "
12[2023-04-01 18:14:44.358][1535551][trace][http] [source/common/http/http1/codec_impl.cc:475] [C17] completed header: key=Rpql value=1
13[2023-04-01 18:14:44.358][1535551][trace][http] [source/common/http/http1/codec_impl.cc:475] [C17] completed header: key=Server value=apache
14[2023-04-01 18:14:44.358][1535551][trace][http] [source/common/http/http1/codec_impl.cc:475] [C17] completed header: key=Set-Cookie value=7F014F6421F98673E55D5BA0F02EB03D:FG=1; max-age=31536000; expires=Sun, 31-Mar-24 10:14:42 GMT; path=/; version=1; comment=bd
15[2023-04-01 18:14:44.358][1535551][trace][http] [source/common/http/http1/codec_impl.cc:475] [C17] completed header: key=Set-Cookie value=delPer=0; path=/
16[2023-04-01 18:14:44.358][1535551][trace][http] [source/common/http/http1/codec_impl.cc:475] [C17] completed header: key=Set-Cookie value=search_mapping=deleted; expires=Thu, 01-Jan-1970 00:00:01 GMT; path=/
17[2023-04-01 18:14:44.358][1535551][trace][http] [source/common/http/http1/codec_impl.cc:475] [C17] completed header: key=Set-Cookie value=bzt_device_sn=deleted; expires=Thu, 01-Jan-1970 17:00:00 GMT; path=/
18[2023-04-01 18:14:44.358][1535551][trace][http] [source/common/http/http1/codec_impl.cc:475] [C17] completed header: key=Set-Cookie value=bzt_username=deleted; expires=Thu, 01-Jan-1970 17:00:00 GMT; path=/
19[2023-04-01 18:14:44.358][1535551][trace][http] [source/common/http/http1/codec_impl.cc:475] [C17] completed header: key=Set-Cookie value=BDSVRTM=2374; path=/
20[2023-04-01 18:14:44.358][1535551][trace][http] [source/common/http/http1/codec_impl.cc:475] [C17] completed header: key=Set-Cookie value=PSINO=1; path=/
21[2023-04-01 18:14:44.358][1535551][debug][client] [source/common/http/codec_client.cc:149] [C17] Error dispatching received data: http/1.1 protocol error: HPE_INVALID_HEADER_TOKEN
22[2023-04-01 18:14:44.358][1535551][debug][connection] [source/common/network/connection_impl.cc:133] [C17] closing data_to_write=0 type=1
23[2023-04-01 18:14:44.358][1535551][debug][connection] [source/common/network/connection_impl.cc:243] [C17] closing socket: 1
验证Time\s: 确实会触发报错
随便找个不报错的服务,本地启动一个nginx,转发流量到该服务,且添加header Time : xxx,将enovy本地配置转发到改 nginx服务,即可复现错误,且可以通过调整是否添加此header来验证。
1location / {
2 add_header "Time " "xxx";
3 prox_pass http://服务;
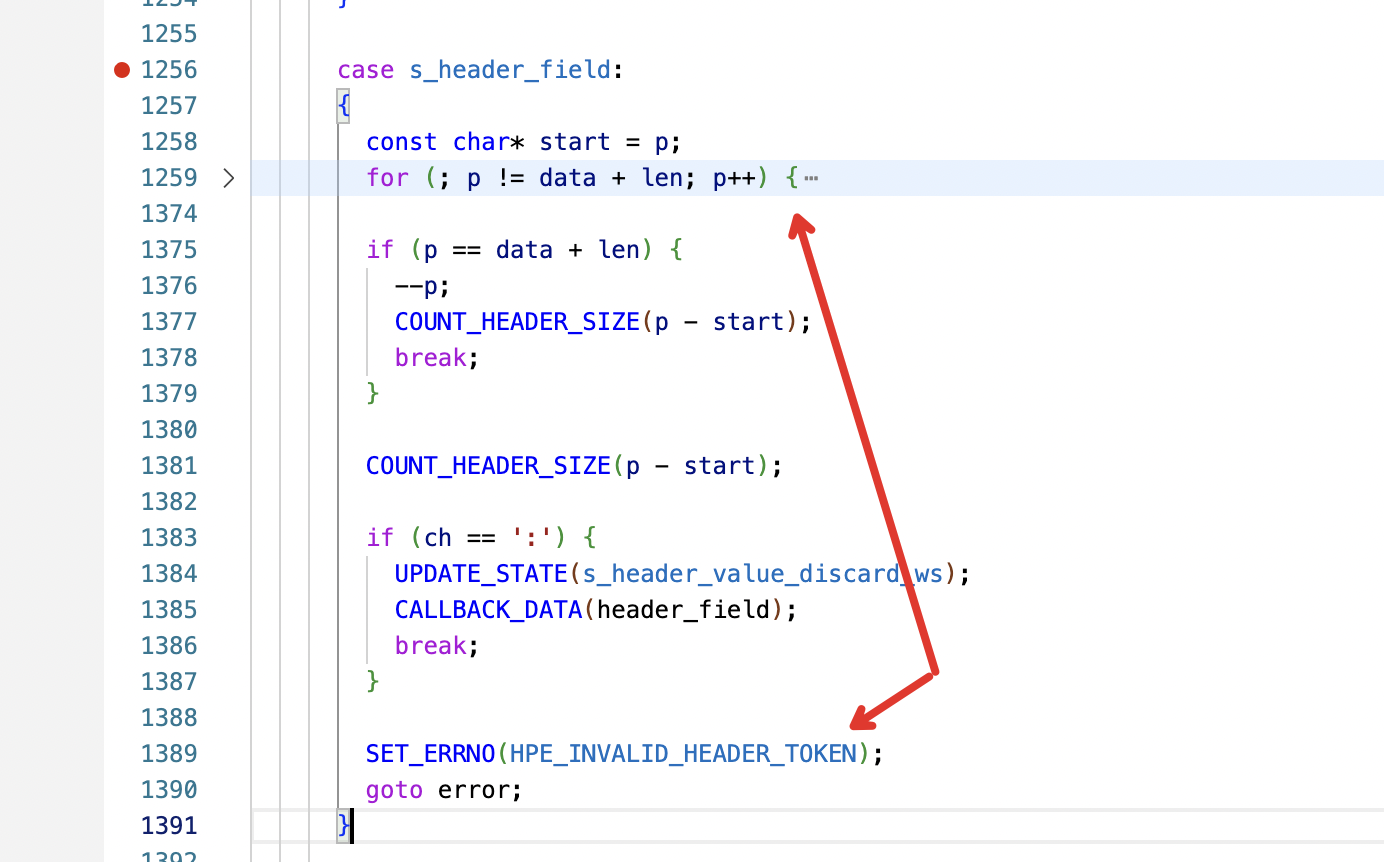
4}Envoy 源码报错定位
日志debug信息
1source/common/http/http1/codec_impl.cc:475 [C17] completed header: key=Set-Cookie value=PSINO=1; d
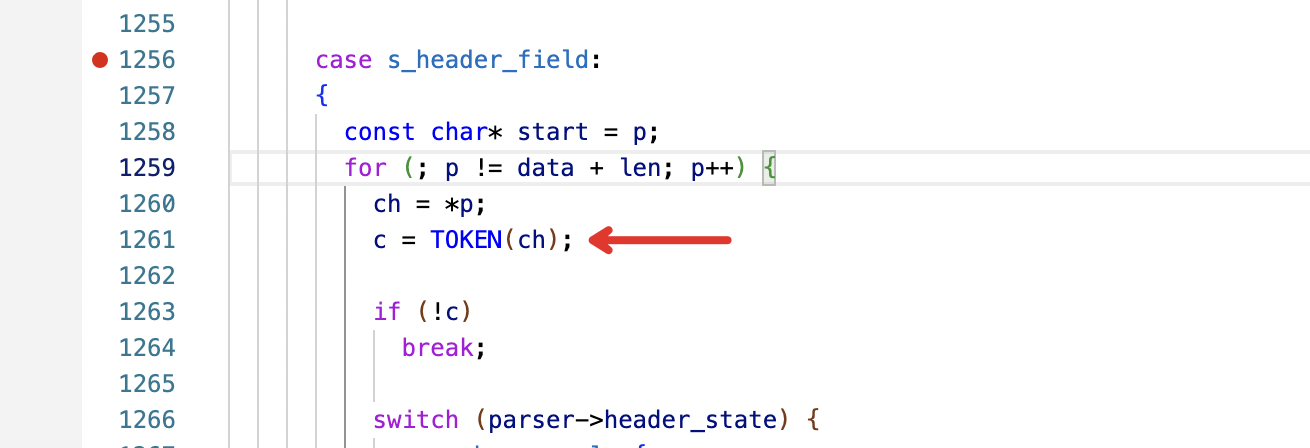
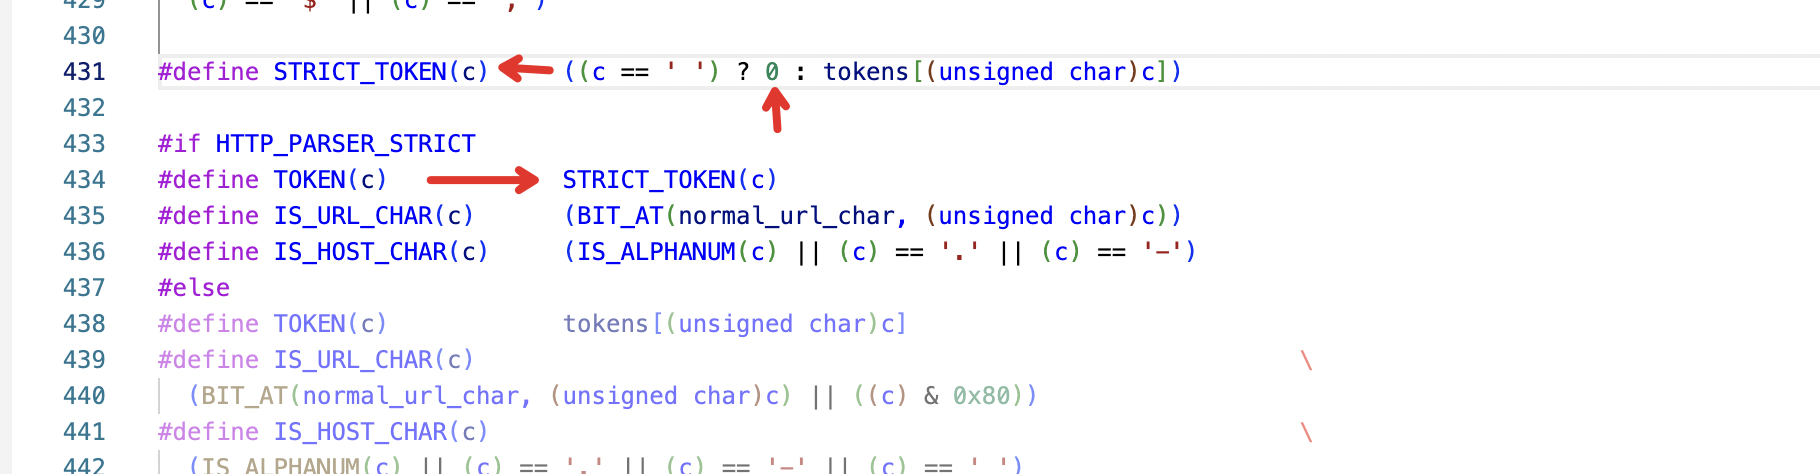
2source/common/http/codec_client.cc:149 [C17] Error dispatching received data: http/1.1 protocol error: HPE_INVALID_HEADER_TOKEN代码校验header位置:https://github.com/nodejs/http-parser/blob/5c5b3ac62662736de9e71640a8dc16da45b32503/http_parser.c
http_parser.c
解决方案
解决方式:修改业务中相关的接口代码,将 header 中的 key 设置正确。
参考
- https://github.com/istio/istio/issues/36711
- https://github.com/istio/istio/issues/31458
- https://stackoverflow.com/questions/72808664/istio-error-dispatching-received-data-http-1-1-protocol-error-unsupported-tra
- https://github.com/istio/istio/issues/39706
某业务接入Mesh某个接口不通
现象
某个业务接入 Mesh 后,部分接口出现 502。
访问以下接口,直接返回 502。
1curl -v 'http://x.x.x.x:80/api/v1/hub/meta/attachment?attachmentId=20230303035842-xhchy&fileName=%E7%A7%81%E5%AF%86%E9%A1%B9%E7%9B%AE%E5%8F%82%E4%B8%8E%E4%BA%BA%E5%91%98%E4%BF%9D%E5%AF%86%E6%89%BF%E8%AF%BA%E4%B9%A6.pdf' -H'cookie: xxx' -H'host:xxx.baidu.com'Envoy 的 trace 日志是:
2023-03-06T13:23:40.384836Z debug envoy client [C14158] Error dispatching received data: http/1.1 protocol error: HPE_INVALID_HEADER_TOKEN。
12023-03-06T13:23:40.381998Z     debug   envoy router    [C14938][S1043862392353535809] upstream headers complete: end_stream=false
2'date', 'Mon, 06 Mar 2023 13:23:40 GMT'
3'content-type', 'application/pdf'
4'content-length', '108860'
5'accept-ranges', 'bytes'
6'content-md5', '+e4pDfRHe+JDTsww5MGeOw=='
7'etag', '"f9ee290df4477be2434ecc30e4c19e3b"'
8'expires', 'Thu, 09 Mar 2023 13:23:40 GMT'
9'last-modified', 'Thu, 02 Mar 2023 19:58:42 GMT'
10'server', 'envoy'
11'x-bce-expiration-date', '2022-11-25T00:00:00Z'
12'x-bce-request-id', '358f4bdc-5d3e-4209-92c5-8156b65a1a06'
13'x-bce-storage-class', 'STANDARD'
14'x-envoy-upstream-service-time', '52'
15
162023-03-06T13:23:40.384836Z     debug   envoy client    [C14158] Error dispatching received data: http/1.1 protocol error: HPE_INVALID_HEADER_TOKEN
172023-03-06T13:23:40.384855Z     debug   envoy connection        [C14158] closing data_to_write=0 type=1
182023-03-06T13:23:40.384904Z     debug   envoy client    [C14158] request reset
192023-03-06T13:23:40.384913Z     debug   envoy router    [C14935][S15319585049759823265] upstream reset: reset reason: protocol error, transport failure reason:
202023-03-06T13:23:40.384978Z     debug   envoy http      [C14935][S15319585049759823265] Sending local reply with details upstream_reset_before_response_started{protocol_error}
212023-03-06T13:23:40.385016Z     debug   envoy http      [C14935][S15319585049759823265] encoding headers via codec (end_stream=false):
22':status', '502'
23'content-length', '87'
24'content-type', 'text/plain'
25'date', 'Mon, 06 Mar 2023 13:23:39 GMT'
26'server', 'istio-envoy'
27'x-envoy-decorator-operation', ':0/*'
原因
问题根因:业务代码在返回response时新增header,header中为encode文件名,导致502错误。

解决方案
解决方式:修改业务中相关的接口代码,将 fileName 正确地 Encoding。
某业务访问某服务 mesh配置失效问题
现象
某业务配置了envoyfilter去给请求增加header,请求集群内的服务有header,请求集群外的服务没有header。
原因
上游未找到被访问服务对应的信息,导致outbound透传了,没有执行用户配置的envoyfilter逻辑。

解决方式
将被访问服务信息通过serviceEntry信息导入到集群中。参考https://istio.io/latest/docs/reference/config/networking/service-entry/
Istiod出现报错
现象
istiod 启动过程中出现以下报错。
1Warning FailedMount 8s (x6 over 24s) kubelet MountVolume.SetUp failed for volume "istio-token" : failed to fetch token: the API server does not have TokenRequest endpoints enabled原因
解决方案
根据 k8s 平台是否支持 jwtPolicy third-party 自动调整 values.global.jwtPolicy 策略。
1istioctl manifest generate --set values.global.jwtPolicy=first-party-jwt  > first-party-jwt.yaml
2
3istioctl manifest generate --set values.global.jwtPolicy=third-party-jwt  > third-party-jwt.yaml
参考
pod处于terminating状态,流量丢失问题
问题
pod处于terminating状态,流量丢失问题。
原因
用户部署过程中,某服务侧同步新版本 pod 需要耗时几分钟,这个时候旧版本 pod 处于 terminating 状态,业务使用 preStop 让当前状态的 pod 还可以接受流量,直到服务侧更新完成。但是注入sidecar容器后,sidecar容器会在 pod 状态变为 terminating 后直接拒绝流量,导致在变更的几分钟 导向旧版本 pod 的流量全部丢失。
解决方案
临时方案
直接在sidecar的cm中添加prestop。
1  {{- else if $holdProxy }}
2    lifecycle:
3      postStart:
4        exec:
5          command:
6          - pilot-agent
7          - wait
8      preStop:
9        exec:
10          command:
11          - sh
12          - -c
13          - |
14            while true; do
15              if curl -s http://127.0.0.1:8080/health; then
16                sleep 5
17              else
18                break
19              fi
20            done
21  {{- end }}
期望方案
terminationDrainDuration
https://istio.io/latest/docs/reference/config/istio.mesh.v1alpha1/
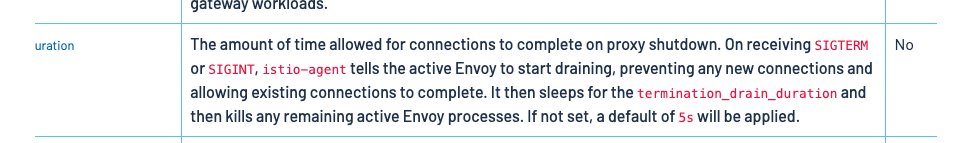
cm istio中 设置这个参数。设置为30min后,退出时envoy日志如下:
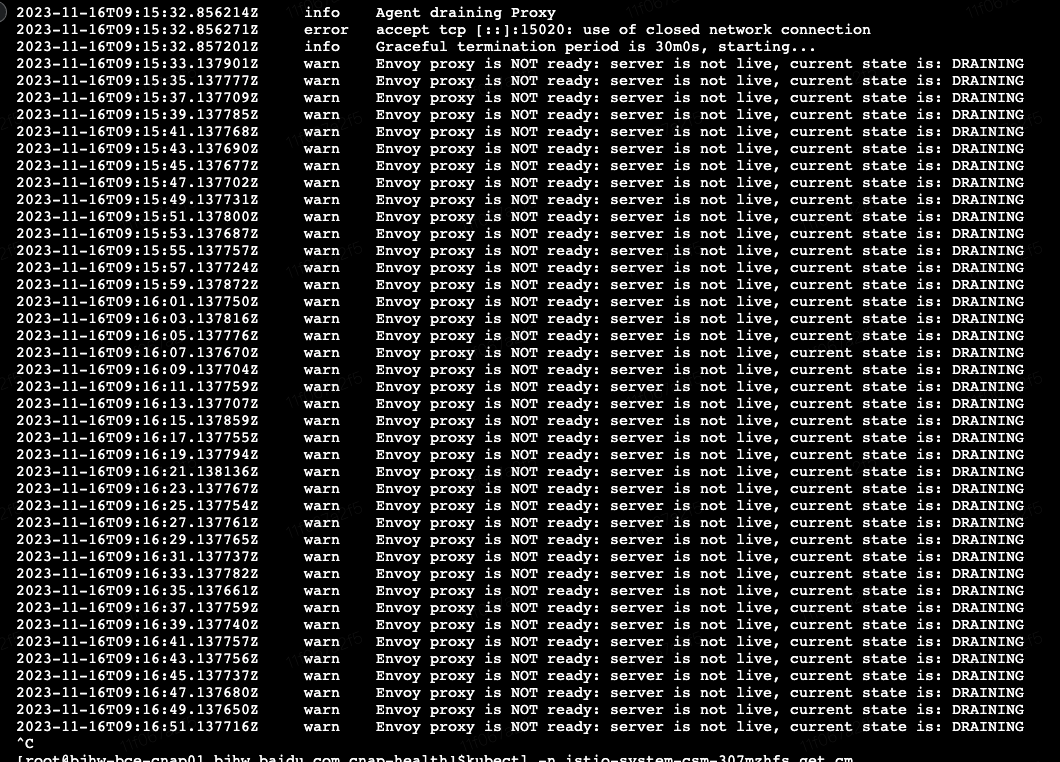
实测,主容器存活的情况下,curl主容器的health端口会被拒绝,看起来与描述一致,拒绝了新请求。
参考
https://github.com/istio/istio/issues/36517 https://github.com/istio/istio/pull/35059
istio 支持的 openTelemetry 没有收集到 trace 数据
问题
OpenTelemetry 不能收集到 trace 数据。
原因
istio configmap 配置的地址网络不通。
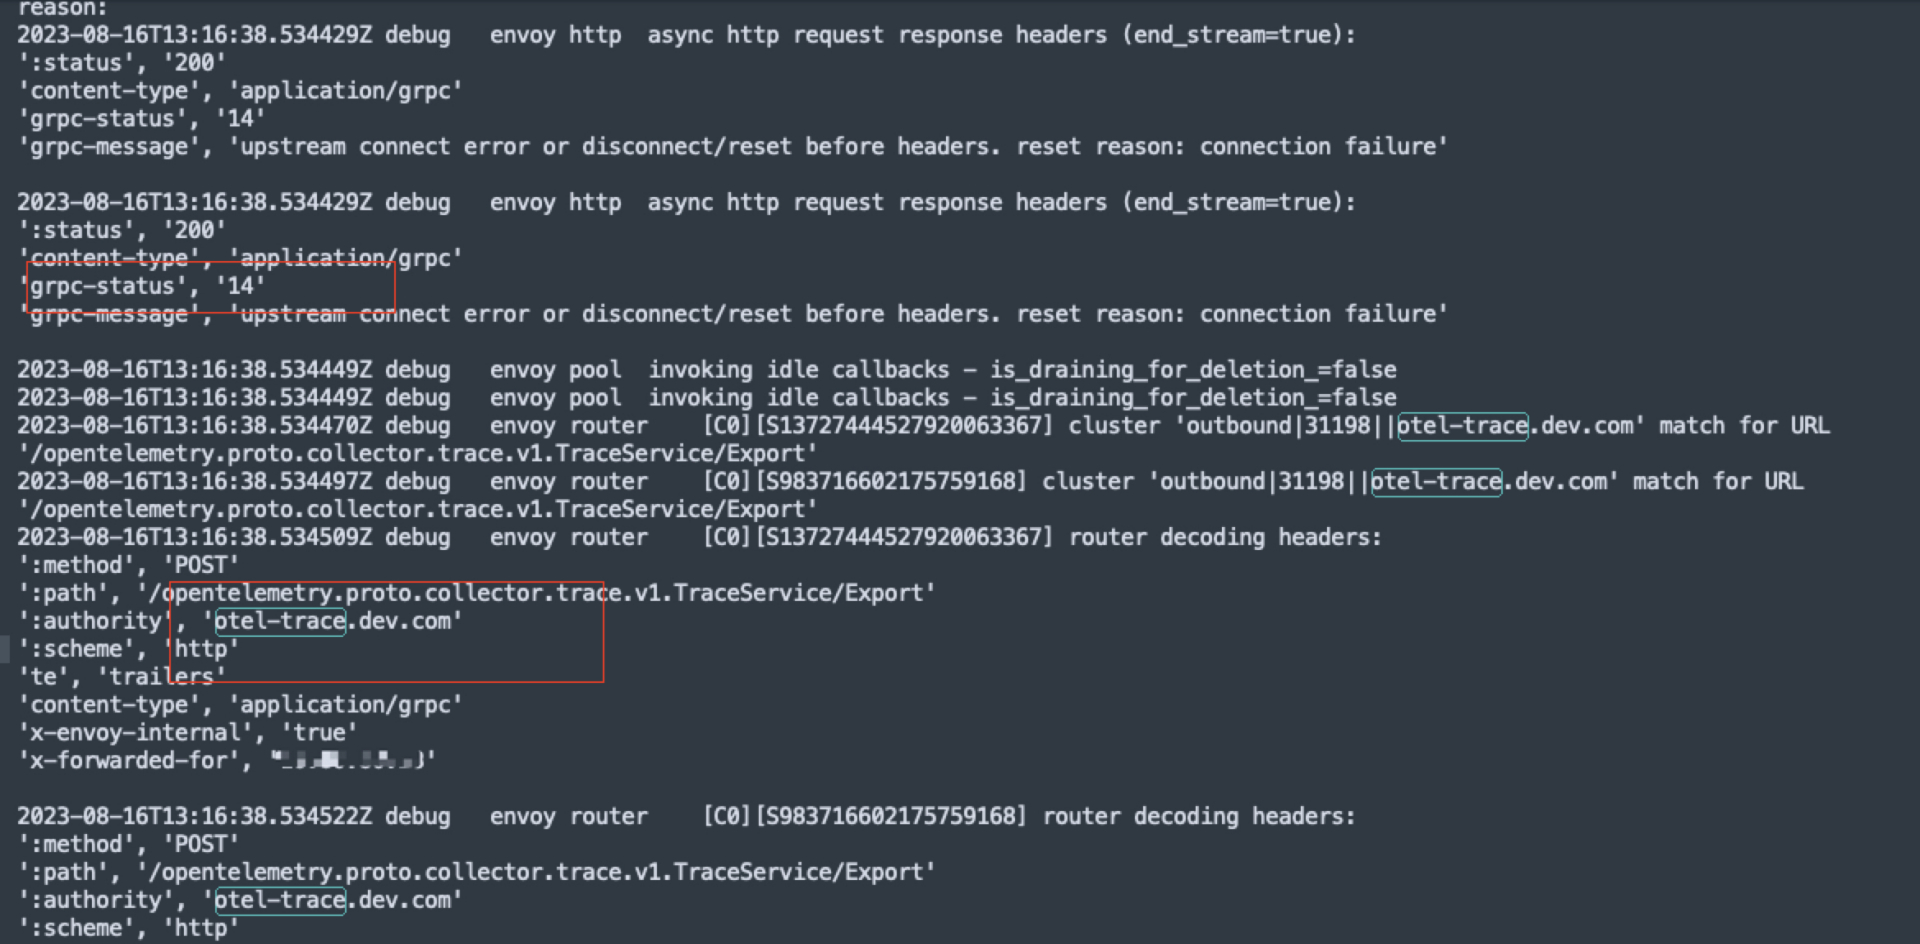
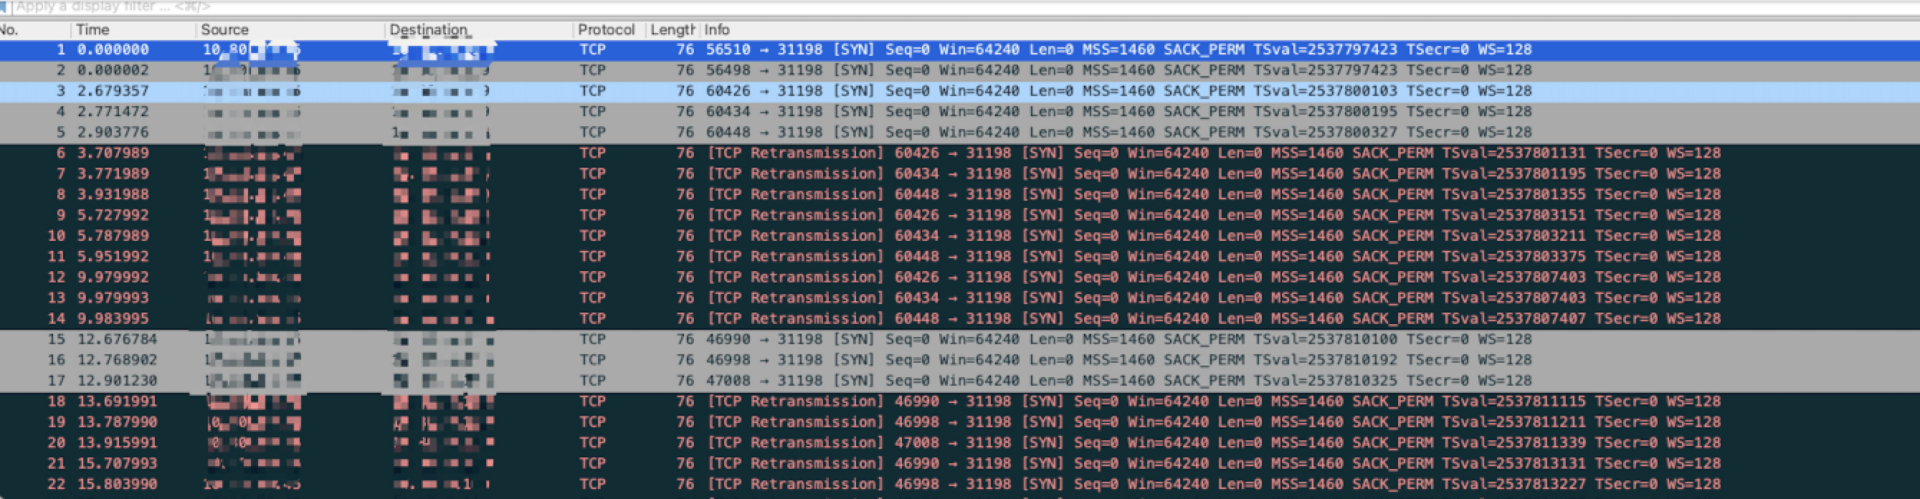
解决方式
配置正确的 trace 地址。
参考
https://istio.io/latest/docs/tasks/observability/logs/otel-provider/
istio-proxy 没有 access_log 日志
问题
istio-system 命名空间配置了accesslog,但是 istio-proxy 没有日志。
配置如下:
1apiVersion: v1
2data:
3 mesh: |-
4 accessLogEncoding: JSON
5 accessLogFile: /dev/stdout
6 defaultConfig:
7 discoveryAddress: istiod/istio-system.svc:15012
8 holdApplicationUntilProxyStarts: true
9 meshId: csm-u7r86kt8
10 proxyMetadata:
11 ISTIO_META_DNS_AUTO_ALLOCATE: "true"
12 ISTIO_META_DNS_CAPTURE: "true"
13 proxyStatsMatcher:
14 inclusionPrefixes:
15 - thrift
16 - dubbo
17 - kafka
18 - meta_protocol
19 inclusionRegexps:
20 - .*dubbo.*
21 - .*thrift.*
22 - .*kafka.*
23 - .*zookeeper.*
24 - .*meta_protocol.*
25 tracing:
26 zipkin:
27 address: zipkin.istio-system:9411
28 enableTracing: true
29 extensionProviders:
30 - name: otel
31 opentelemetry:
32 port: 31504
33 service: x.x.x.x
34 enablePrometheusMerge: true
35 rootNamespace: istio-system
36 trustDomain: cluster.local
37 meshNetworks: 'networks: {}'
38kind: ConfigMap
39metadata:
40 creationTimestamp: "2023-08-11T07:31:14Z"
41 labels:
42 install.operator.istio.io/owning-resource: unknown
43 istio.io/rev: default
44 operator.istio.io/component: Pilot
45 release: istio
46 name: istio
47 namespace: istio-system
48 resourceVersion: "1536380"
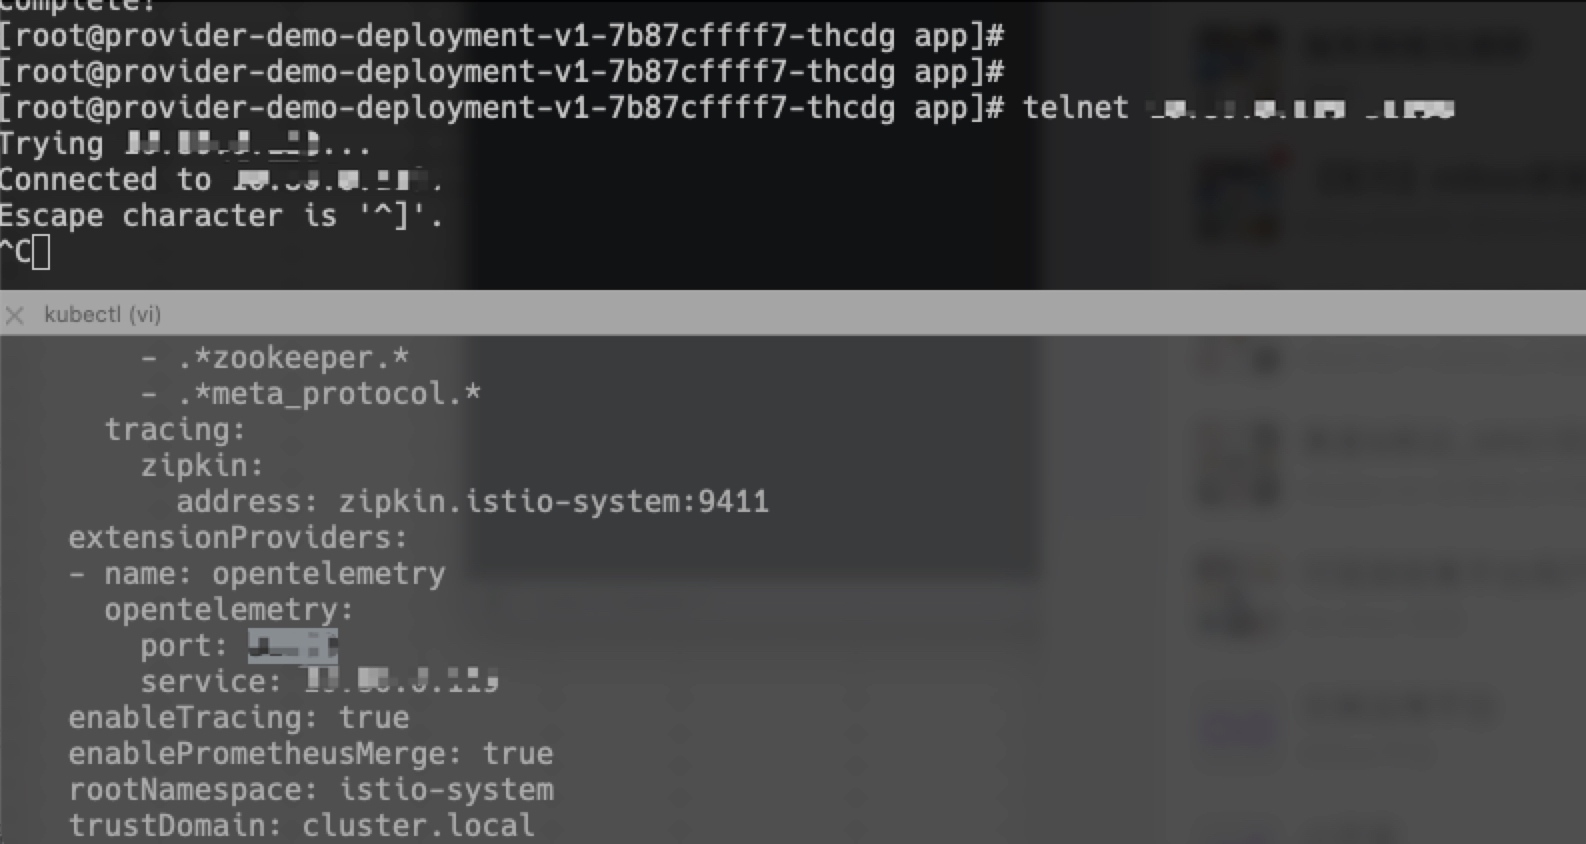
49 uid: d89e1f61-f9af-4f5e-9eaa-b26616fb267e原因
discoveryAddress: istiod/istio-system.svc:15012 配置错误,可以通过 istiod 控制平面报错日志看出来。
解决方式
将 discoveryAddress: istiod/istio-system.svc:15012 配置为正确的地址 discoveryAddress: istiod.istio-system.svc:15012。
参考
https://cloud.tencent.com/developer/article/2172765
注入 sidecar pod 启动失败
问题:按照CSM操作手册,某个Pod开启sidecar注入后,启动失败,查看pod中的istio-init容器日志,如下报错:
12023-11-02T02:25:27.723319Z	info	Running command: iptables-restore --noflush /tmp/iptables-rules-1698891927723191413.txt835755000
22023-11-02T02:25:27.724588Z	error	Command error output: xtables parameter problem: iptables-restore: unable to initialize table 'raw'
3
4Error occurred at line: 1
5Try `iptables-restore -h' or 'iptables-restore --help' for more information.
62023-11-02T02:25:27.724604Z error Failed to execute: iptables-restore --noflush /tmp/iptables-rules-1698891927723191413.txt835755000, exit status 2原因:CCE集群中可能存在Istio不支持的Node节点,如BaiduLinux、Centos8等内核。具体原因可参见Istio前置条件。Centos8及一些红帽系Linux使用iptables-nftables,不使用iptables模块。Istio通过使用iptables添加nat规则来拦截流量,Linux应该启用netfix linux内核模块。
解决办法: 永久生效(需要重启CCE集群上的Node节点机器),在节点Node上执行以下操作:
1cat >/etc/modules-load.d/99-istio-modules.conf <<EOF
2br_netfilter
3nf_nat
4nf_nat_redirect
5xt_REDIRECT
6xt_owner
7iptable_nat
8iptable_mangle
9iptable_filter
10EOF
11# 重启下机器
12reboot
临时生效(不需要重启CCE集群上的Node节点机器,机器重启后失效),在节点Node上执行以下操作:
1modprobe br_netfilter
2modprobe nf_nat
3modprobe nf_nat_redirect
4modprobe xt_REDIRECT
5modprobe xt_owner
6modprobe iptable_nat
7modprobe iptable_mangle
8modprobe iptable_filter
如何禁用 Sidecar 注入
如果命名空间启用了 Sidecar 自动注入,但希望该命名空间下的某个 pod 不注入 Sidecar,可以通过在 Pod 模板中添加 label 实现:
1template:
2  metadata:
3    labels:
4      sidecar.istio.io/inject: "false"
以 cronjob 为例
1apiVersion: batch/v1
2kind: CronJob
3metadata:
4  name: hello-cronjob
5spec:
6  schedule: "* * * * *"
7  jobTemplate:
8    spec:
9      template:
10        metadata:
11          labels:
12            sidecar.istio.io/inject: "false"
13        spec:
14          containers:
15          - name: hello
16            image: registry.baidubce.com/csm-offline/busybox
17            command: ["/bin/sh", "-c", "date; echo Hello from Kubernetes CronJob"]
18          restartPolicy: OnFailure
评价此篇文章